As a Power BI professional, you’ve probably mastered the art of creating insightful reports and dashboards by leveraging various data sources. But with the advent of Microsoft Fabric, the landscape of data analytics has evolved significantly, offering more efficient and streamlined processes.
In this article, we will explore a detailed comparison between the traditional Power BI workflow and the integrated Microsoft Fabric ecosystem. We will examine how data is ingested, transformed, stored, modeled, and visualized in both environments, highlighting the enhanced capabilities and solutions offered by Microsoft Fabric.
Traditional Power BI Workflow
In a typical Power BI workflow, data is ingested from various sources, transformed with Power Query, and then visualized in reports. This process, while effective, can be limited by scalability, performance issues, and the complexity of integrating multiple data sources and tools.

Microsoft Fabric Ecosystem
In the Microsoft Fabric ecosystem, the workflow is optimized to handle both structured and unstructured data, providing a seamless and efficient process for data ingestion, transformation, storage, modeling, and visualization.
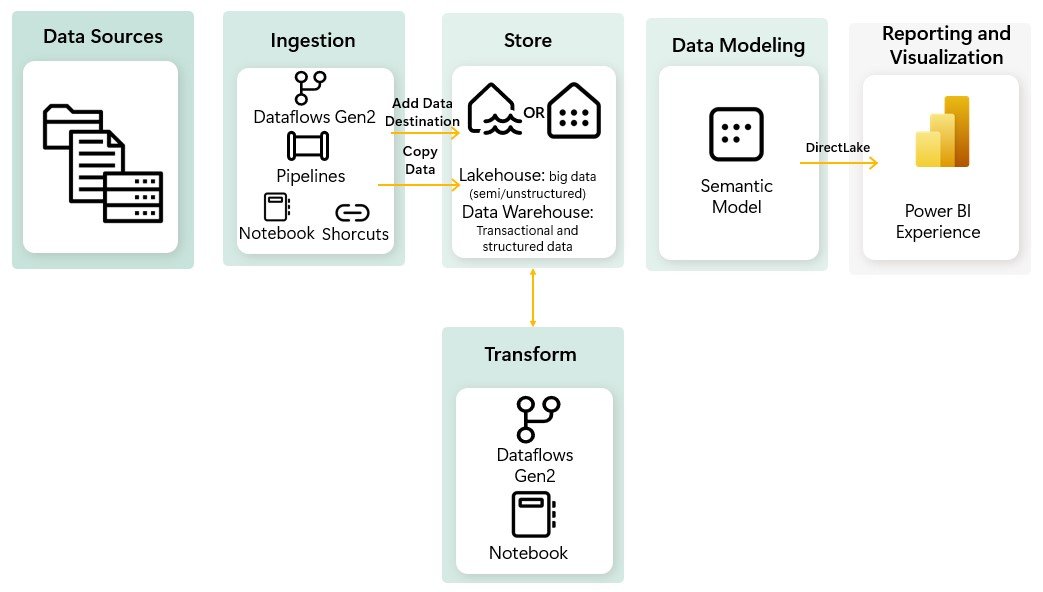
Here’s a detailed look at the stages of a data solution within Microsoft Fabric:
Data Ingestion: The first step in any data solution is to gather data from various sources.In Microsoft Fabric is possible to ingest data from a wide variety of data sources and there multiple ways to Ingest this data:
- Shortcuts: This method allows you to link to existing data without transformation, providing quick access but limited flexibility.
- Notebooks: For developers comfortable with writing code, notebooks offer a powerful way to ingest and transform data using languages like PySpark (Python), Spark (Scala), Spark SQL and SparkR.
- Dataflow Gen2: You are probably familiar with Power Query or Dataflow Gen1. Dataflow Gen2, is the newer version of Dataflows which provides all the capabilities of Power Query and Dataflow Gen1 with the added ability to transform and ingest data into multiple data sources.
- Pipeline Copy Activity: Ideal for high-scale data ingestion with minimal coding, it moves large volumes of data from various sources into a central repository.
Data Transformation: Once the data is ingested, it needs to be cleaned and transformed to be useful for analysis. In Microsoft Fabric, you have several options for data transformation which have specific properties and are suited for different use cases:
- Dataflow Gen2: Provides powerful transformation capabilities through Power Query, perfect for users who prefer a visual interface and need to perform extensive data transformations and wrangling, offering over 300 transformation functions that cover a broad range of data manipulation needs.
- Notebooks: Offer flexibility for complex transformations using code, is suited for scenarios that require advanced data processing capabilities, such as large-scale data transformations, real-time analytics, and machine learning.
- Data pipelines: Allow to orchestrate complex data transformation logic through a sequence of activities. Some common activities include: Copy data, Dataflow, Notebook, For Each, Lookup, Execute a script or stored procedure.
Data Storage: Microsoft Fabric provides robust storage solutions:
- Lakehouse: A unified storage solution combining the scalability of data lakes with the performance of data warehouses.
- Warehouse: For structured data storage and faster query performance.
Data Modeling: With data stored securely, the next step is to create the data model. In Microsoft Fabric the data models are created automatically when you set up a lakehouse or warehouse, inheriting all the business logic from the parent system. This means you can start analyzing your data right away without extra manual setup.
- Default Semantic Model: Microsoft Fabric creates a default Power BI semantic model when you set up a lakehouse or warehouse. This model inherits the business logic from its parent lakehouse or warehouse, providing a ready-to-use analytical layer with pre-defined relationships, measures, and hierarchies.
You can choose which tables and views to include in the default semantic model, avoiding unnecessary background sync and keeping your data model lean and efficient. It is ideal for quickly generating reports and dashboards without extensive customization.

- Creating a New Semantic Model: Sometimes, you might need more customized data models with specific business logic, custom calculations or unique relationships not covered by the default model. In these cases, the recommendation is to create a new and customized Power BI semantic model which allows for more control over data loading and querying processes, ensuring optimal performance, especially with large datasets.
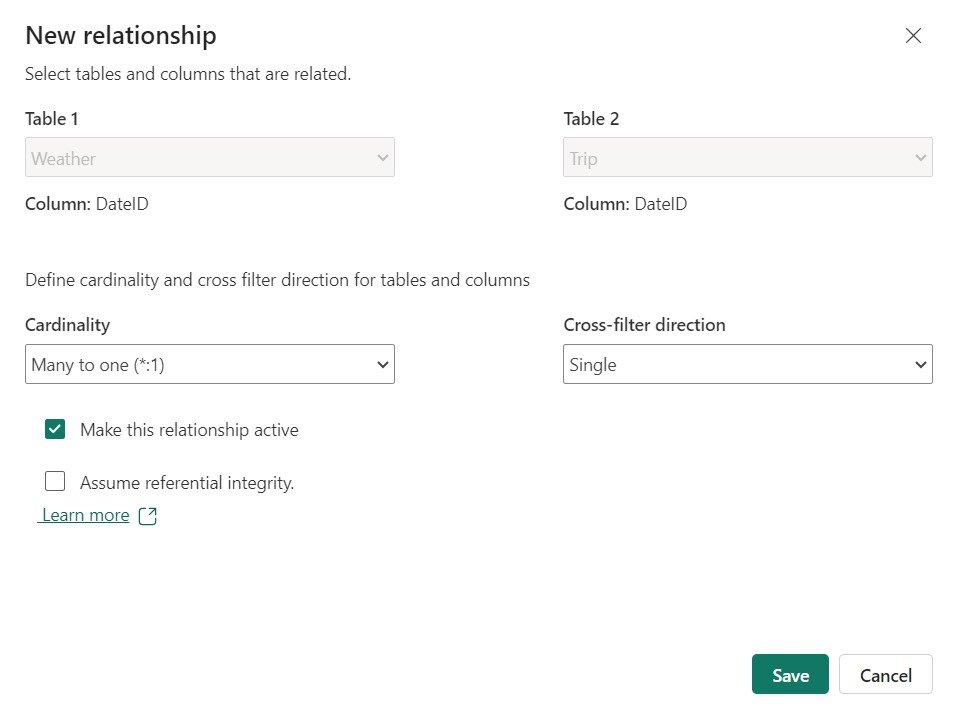
In the semantic models we can create relationships similar to Power BI:

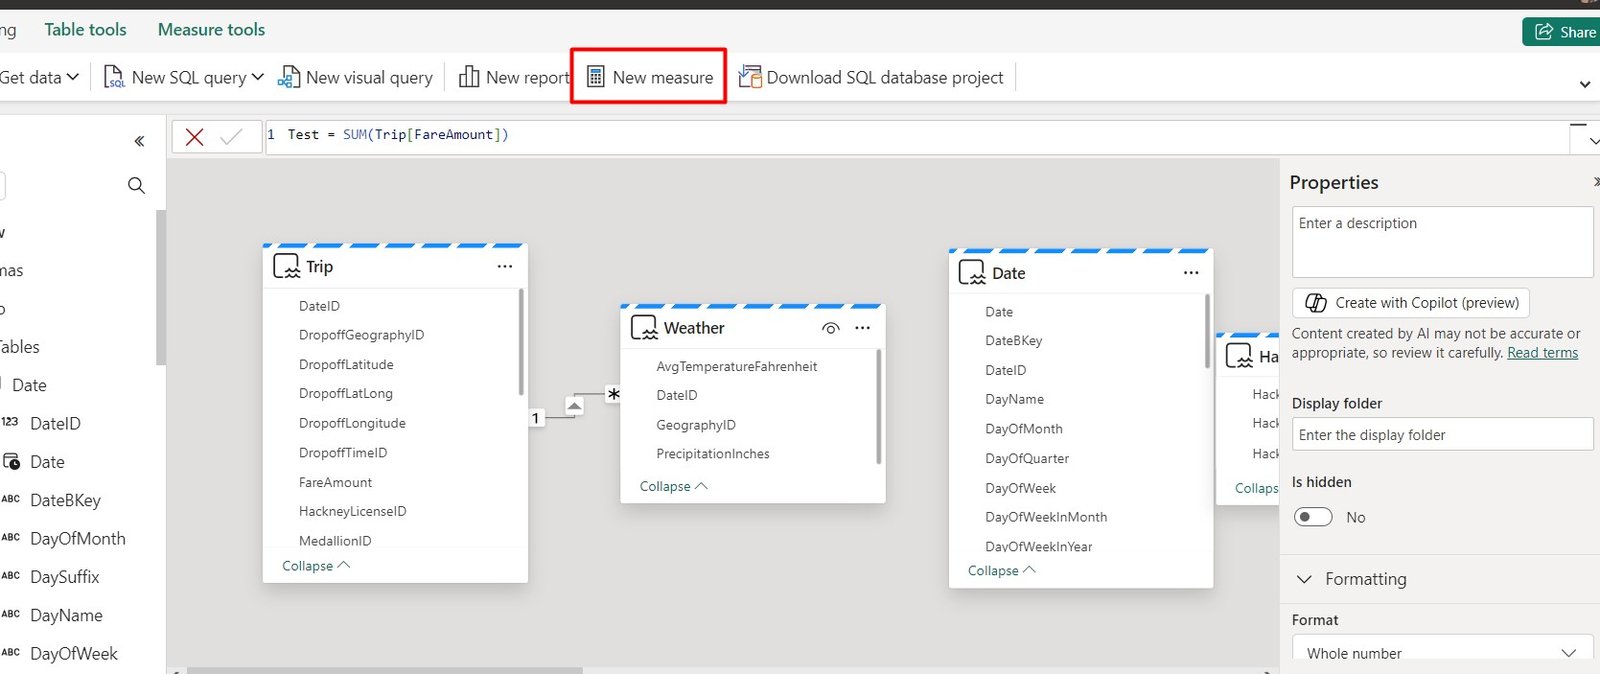
And we have the ability to create DAX measures:
Data Visualization: Microsoft Fabric leverages the Power BI Experience for reporting and visualization, allowing users to use familiar tools and functionalities. Power BI offers robust features for creating detailed reports, dashboards, and visual analytics, making it easy to turn data into actionable insights. With Direct Lake mode, users can directly query data stored in a Lakehouse without needing to import it, enhancing performance and efficiency.
Comparison: End-to-End Solution with Power BI vs. Microsoft Fabric

Data Analyst Common Challenges and Solution with Fabric

Scenario for Power BI Data Analysts
Now that we’ve covered the fundamentals, let’s dive into a practical scenario for Power BI data analysts. This example will illustrate how to leverage Microsoft Fabric to streamline your workflow and enhance your data analysis capabilities.
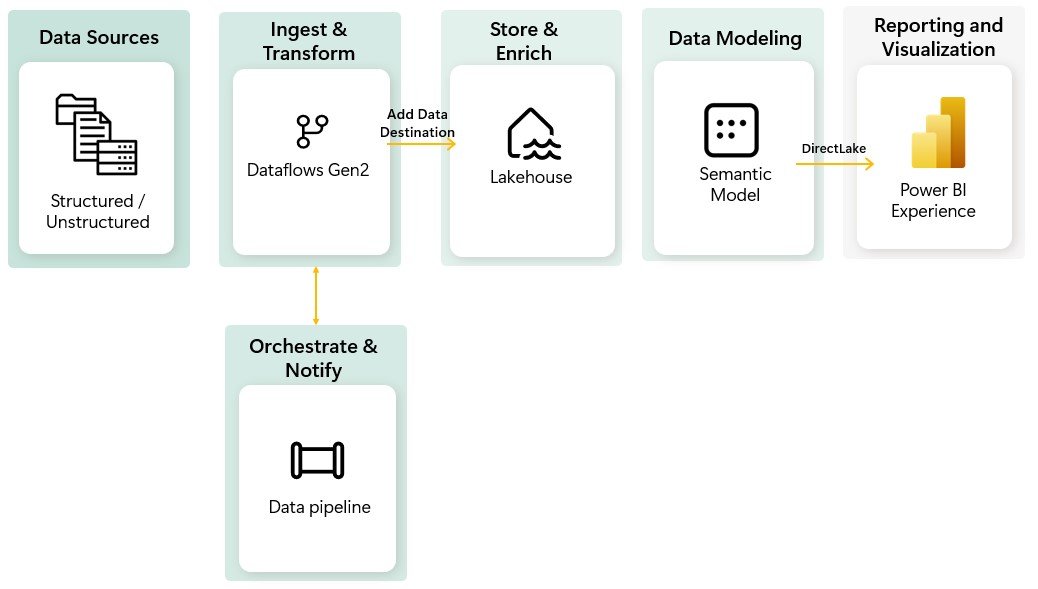
Data Sources: The workflow starts by gathering data from various structured and unstructured data sources.
Ingest & Transform: Use Dataflows Gen2 to ingest data because in addition to offering robust transformation capabilities, it is very similar to Power Query, allowing analysts to efficiently cleanse and prepare data in an environment familiar to them.
Data Transformation: Within Dataflows Gen2, data is transformed as per business requirements. This includes cleaning, shaping, and combining data from multiple sources.
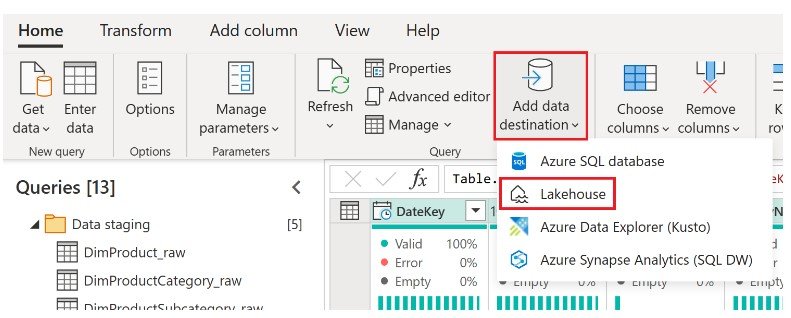
Dataflows Gen2 introduces a powerful new capability to add data to a destination which is a very significant enhancement, allowing users to specify where the processed data should be stored, such as a Lakehouse, Warehouse, and many more. This flexibility allows you to write your data to the destination and then use it for further analysis and reporting:
Data Storage: The transformed data is stored in a Lakehouse, which combines the scalability of data lakes with the performance of data warehouses. This unified storage solution supports both structured and unstructured data, making it accessible for various analytical processes.
Data Orchestration: Data Pipelines are used to orchestrate and automate the workflow. It manages the sequence in which tasks are executed, using control flow activities like loops, conditional execution, and you can also run one or more dataflows inside a Pipeline, run stored procedures and copying data to create a complete ETL (Extract, Transform, Load) process.
The data pipelines can be scheduled, managing dependencies, managing dependencies and monitoring that data ingestion and transformation processes run smoothly. Notifications and error management mechanisms can also be integrated to maintain workflow efficiency.
Data Modeling: Semantic models serve as the foundation for building analytical solutions with Fabric. It defines relationships, hierarchies, and calculations necessary for accurate data analysis. The semantic model leverages DirectLake capability, which allows real-time data access without the need for frequent refreshes. This ensures that reports and dashboards always display the most up-to-date information.
Reporting and Visualization: Finally, the data is visualized with Power BI. The integration with DirectLake mode enhances the reporting experience by ensuring real-time data access and faster query performance.
Aditional Resources
Microsoft Fabric tutorial for Power BI Users: You can go to the following link https://learn.microsoft.com/en-us/power-bi/fundamentals/fabric-get-started to practice a end-to-end solution focused on Power BI users, where you will be guided on the use of Dataflows Gen2 and Pipelines to ingest data into a Lakehouse and create a dimensional model, and finally how to generate a report automatically in few minutes.
Conclusion
Microsoft Fabric enhances data analysis capabilities by integrating the full data lifecycle—from ingestion and transformation to warehousing, modeling, and visualizationinto a single platform. This seamless integration helps organizations fully utilize their data, streamlining processes and improving decision-making.
While Power BI continues to be a robust tool for data analysis and visualization, Fabric expands on these capabilities by offering a more comprehensive data management solution. . This comprehensive platform, built on the solid foundation of Power BI, delivers a unified ecosystem that accelerates insight, drives data-driven decision making and fosters innovation.
For data professionals familiar with Power BI and analytics, transitioning to Microsoft Fabric represents an opportunity to broaden their skills and influence. Fabric doesn’t just introduce new functionalities; it opens up new possibilities for data professionals to drive significant insights and play a crucial role in strategic decision-making.


