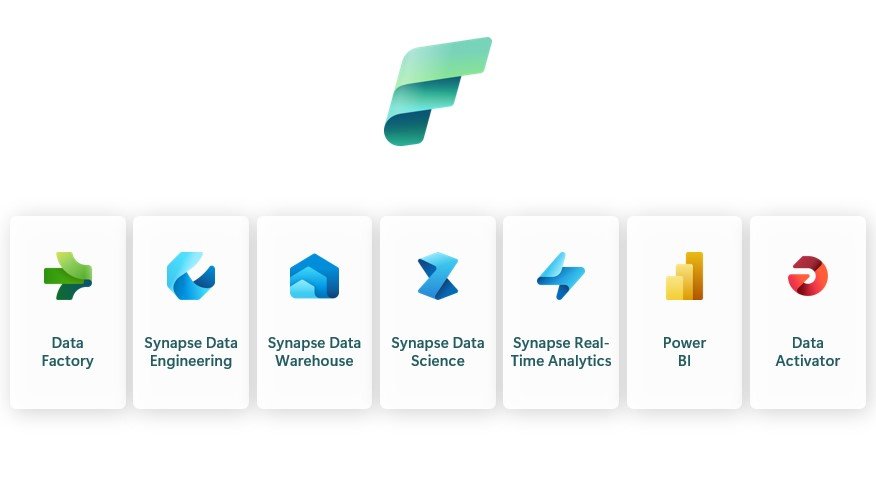
Microsoft Fabric offers seven key experiences tailored to different roles within an organization, making it easy for users to access the analytics tools they need. These experiences are:
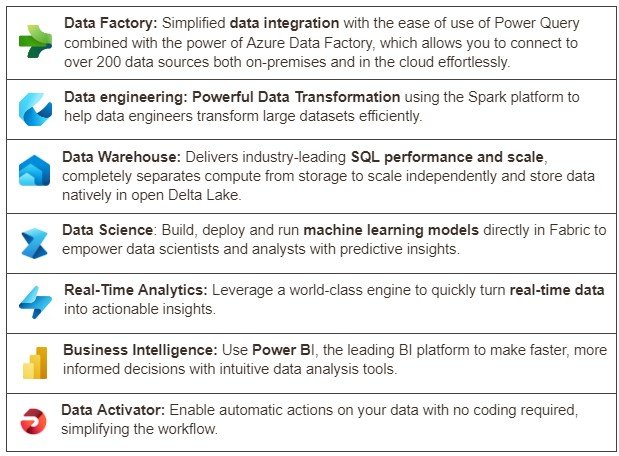
Each experience is a collection of related tools and features designed for specific tasks. For example, the Data Engineering experience includes everything a data engineer needs, like creating notebooks for data transformation and landing data in Parquet format.
Fabric experiences guide users on what tools are available, helping them utilize the right functionalities for their roles. Power BI, Data Factory, and Data Activator are standalone experiences, while Data Engineering, Data Science, Data Warehouse, and Real-Time Analytics are powered by Synapse.
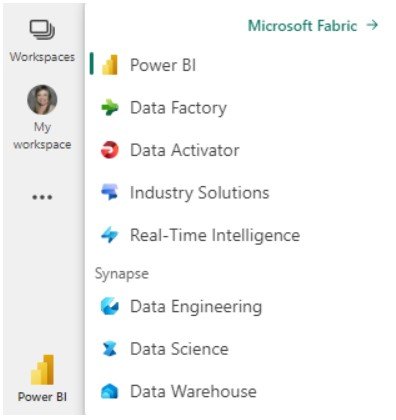
Additionally you will see the Industry Solutions Experience, which offers tailored data solutions designed to help companies address specific industry challenges, optimize operations, integrate data from multiple sources and leverage powerful analytics.
Overall, these experiences work together on a unified lake-first foundation, helping organizations unlock the full value of their data.
Data Factory Experience – Data Integration
Combining the best of Azure Data Factory and Power Query, Data Integration brings together low-code, AI-enabled experiences, multi-cloud connectivity, and persistent data security and governance to help solve complex scenarios for all developers.
Key features include:
- 200+ native data source connectors.
- Cloud-scale data movement with Data Factory.
- Low-code interface for ingesting data from hundreds of data sources using Dataflows Gen2.
- Ability to handle large-scale data (petabyte-scale).
- Governance through Purview, ensuring enterprise-level data management, operations, continuous integration/continuous deployment (CI/CD), application lifecycle management, and monitoring.
Available items in Data Factory:
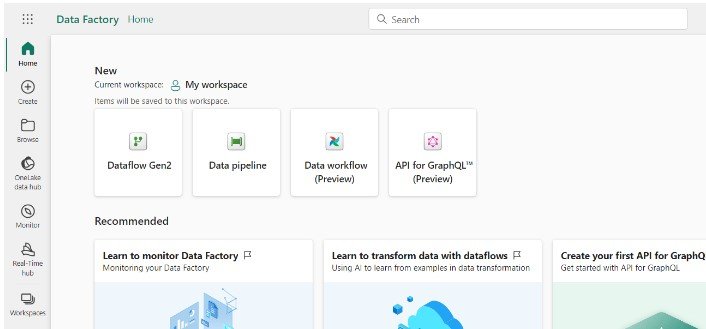
- Dataflow Gen2: provides a low-code interface for data ingestion and transformation using a cloud-based version of Power Query, making it ideal for low-code developers and Power BI data analysts. It enables users to seamlessly integrate and prepare data directly in the cloud, build ETL processes, and perform data transformations on a large scale. Dataflow Gen2 supports writing data to various destinations, including Fabric lakehouses, Azure SQL Database, Azure Data Explorer, and Azure Synapse Analytics.
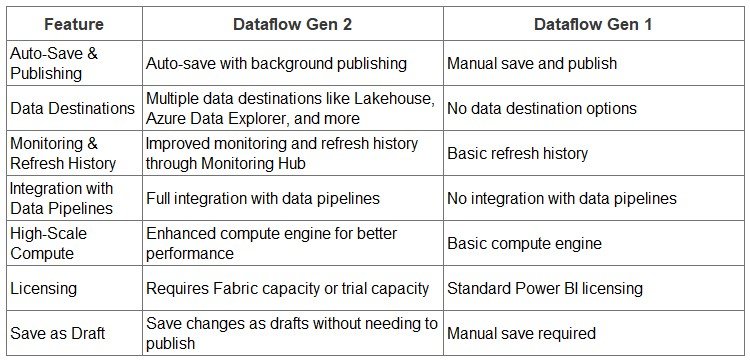
Dataflows Gen 2 vs Gen 1
- Data Pipeline: A comprehensive tool used to orchestrate the movement and transformation of data across different systems and stages.
Additionally in preview you will see:
- Data Workflows: Make building and managing data pipelines easy. Powered by Apache Airflow, it offers instant setup, auto-scaling, and smart pausing to save costs. You can create, schedule, and monitor data workflows in a cloud-based platform with strong security.
- API for GraphQL: Lets you easily create, use, and manage APIs to access data from different sources, making data interactions simple and efficient. It’s a flexible and powerful way to connect your data to analytics applications.
Synapse Data Engineering Experience
Data Engineering enables data engineers to transform data with a low-code Lakehouse experience fully integrated with Data Factory, to transform and democratize data at scale. It features Synapse Spark serverless computing, low-code and professional authoring experiences, and the ability to dynamically scale and orchestrate data.
Available items in Data Engineering:
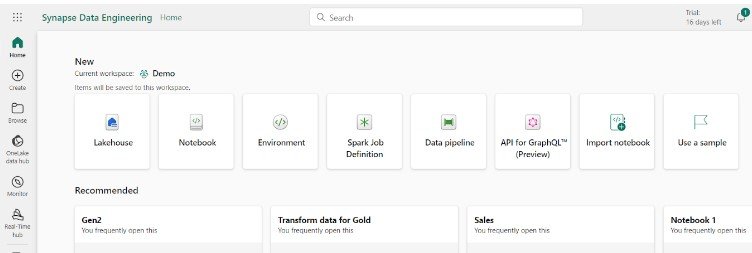
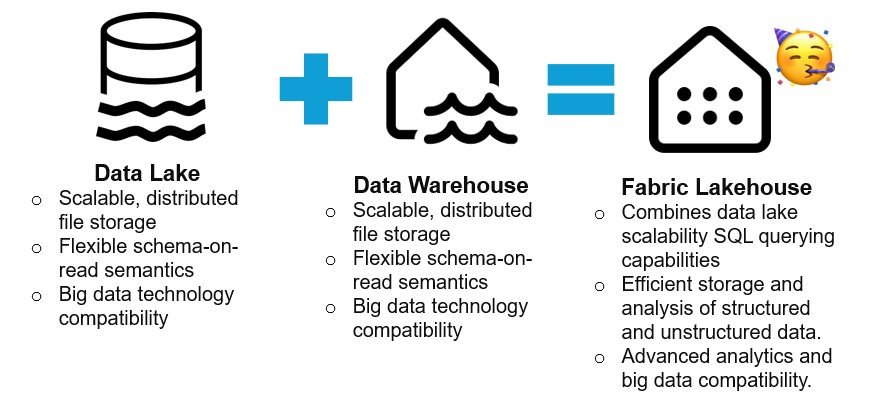
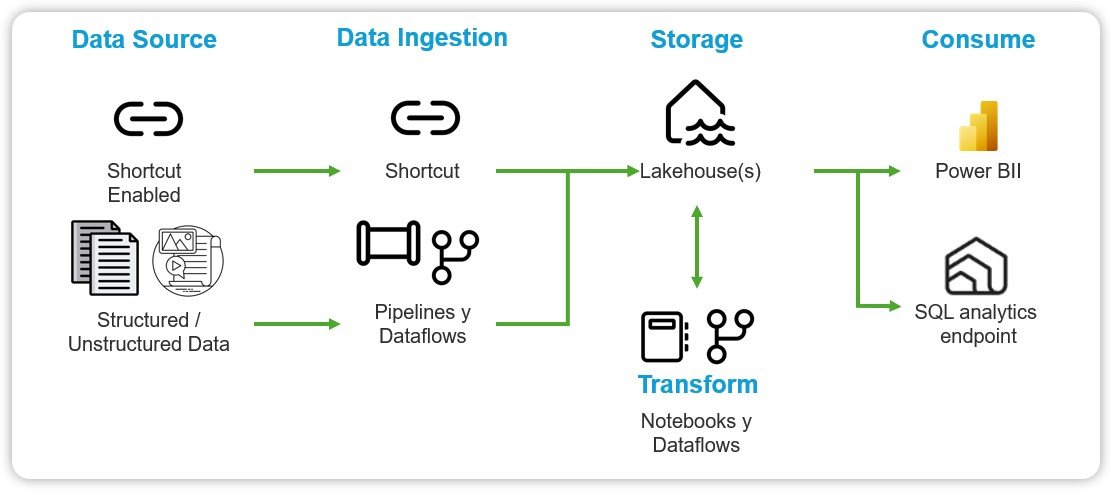
- Lakehouse: A storage solution for big data, used for cleaning, querying, reporting, and sharing data.
- Notebook: For running queries on data to produce shareable tables and visuals, and for building machine learning solutions with Apache Spark applications.
- Environment: Setup for shared libraries, Spark compute settings, and resources for notebooks and Spark job definitions.
- Spark Job Definition: Used to define, schedule, and manage Apache Spark jobs for big data processing.
- Data Pipeline: Used to orchestrate data movement and transformations.
- API for GraphQL: To create a GraphQL API that easily connects your applications to Fabric data sources.
- Import Notebook: Used to import notebooks from a local machine.
- Use a Sample: Used to create a sample dataset for testing and development purposes.
Data Warehouse Experience – Synapse
Data warehouse experience is a modern version of the traditional data warehousing, designed to centralize and organize data from various sources into a single, unified view for analysis and reporting. This experience empowers data engineers, analysts, and data scientists to collaborate effectively, using a blend of low-code and traditional tools to ingest, store, transform, and visualize data.
Key Features:
- Low-Code Experience: Easily ingest, store, transform, and visualize data using both low-code and traditional tools, making it accessible for data engineers and analysts alike.
- SQL Performance: Utilize familiar SQL tools like T-SQL for efficient data operations, including insert, update, and delete.
- Independent Scaling: Scale compute and storage separately to optimize costs and performance.
- Lakehouse Integration: Build relational layers on Lakehouse data stored in Parquet/Delta formats, reducing data duplication.
- Power BI Integration: Seamlessly connect with Power BI for powerful reporting and visualizations.
You’ll have a powerful tool and user-friendly at your disposal that enhances your ability to work with data, from ingestion to reporting, all within a secure and scalable environment. This experience is perfect for Power BI analysts looking to expand their skills and leverage the full potential of their data
Data Warehouse Available Items:
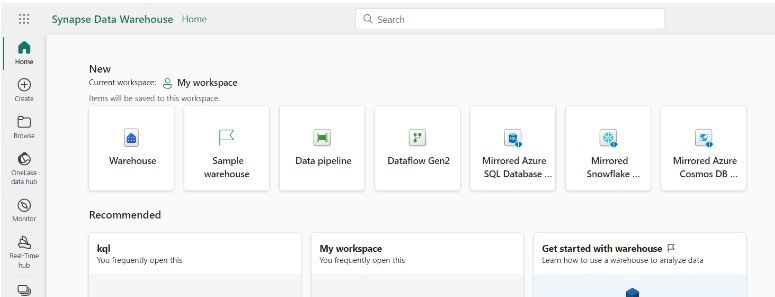
- Warehouse: Used to provide strategic insights from multiple sources.
- Sample warehouse: Allow you to start a new warehouse with sample data already loaded
- Data Pipeline: Used to orchestrate data movement and transformations.
- Dataflow Gen2: Low-code interface for data ingestion, allowing users to easily integrate and prepare data using a cloud-based version of Power Query.
- Mirrored Azure SQL Database: Easily copy Azure SQL databases into OneLake, making data integration simple and enabling advanced analytics without complicated data processing.
- Mirrored Snowflake: Copy Snowflake warehouse data into OneLake, without complex data processing and enabling advanced analytics, BI, AI, and data engineering seamlessly.
- Mirrored Azure Cosmos DB: Easily replicate data from Azure Cosmos DB into OneLake in a format that’s ready for analytics, simplifying data integration.
Data Science Experience – Synapse
The Data Science experience in Microsoft Fabric is designed to help Power BI analysts easily build, deploy, and manage machine learning models using data from various sources. It supports secure collaboration and integrates smoothly with Azure Synapse ML, allowing you to track experiments and manage models effortlessly.
Key Features:
- Easily pull in data from multiple sources and store insights in Lakehouses.
- Use advanced tools to create and share predictive models and business insights.
- Build, test, and track machine learning experiments with MLflow.
- Perform data preparation and feature engineering with easy-to-use tools.
- Collaborate with colleagues using Notebooks, Power BI, and Lakehouses in real time.
- Agile collaboration between data scientists and Power BI through semantic link functionality that enables the creation of real-time dashboards without the need to write code.
Available Items:
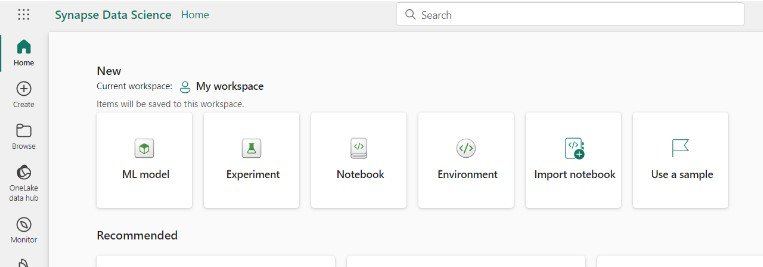
- ML model: Used to create machine learning models to predict outcomes and detect anomalies in data.
- Experiment: Used to create, run, and track development of multiple models for validating hypotheses.
- Notebook: Used to explore data and build machine learning solutions with Apache Spark applications
- Environment: Setup for shared libraries, Spark compute settings, and resources for notebooks and Spark job definitions
- Import Notebook: Used to import notebooks from local machine and for creating Notebooks in workspaces
- Use a Sample: Used to create data science notebooks in Python and R for your use case.
Real Time Experience – Synapse
This experience leverages Kusto Query Language (KQL), a powerful language for querying structured, semi-structured, and unstructured data. KQL is optimized for querying telemetry, metrics, and logs that allow to discover patterns, identify anomalies, outliers and create statistical modeling.
Key Features of Real-Time Experience:
- Real-time analysis and establishment of alerts with data activator to enable proactive decision making and action.
- Scalability and efficient analysis of large volumes of data, allowing to handle petabytes of data with high velocity and low latency.
- AI Integration with Copilot that allows use of natural language to generate queries and explore data, making it accessible to users in different roles.
- Eventstream for data routing,
- KQL database for storage and management. Kusto Query Language (KQL) is a powerful language for querying structured, semi-structured, and unstructured data which is optimized for querying telemetry, metrics, and logs that allow to discover patterns, identify anomalies, outliers and create statistical modeling.
- Integration with other Fabric experiences for comprehensive data analytics
Examples of Real-World Applications
This experience is especially valuable for industries such as finance, logistics, and healthcare, where instant data freshness, time-sensitive data analysis, and low-latency queries are crucial.
- Automotive: Connected fleet applications, autonomous driving, and R&D. For example, at Microsoft Build, a demo showcased Porsche Racing using Real-Time Intelligence to obtain real-time data from car sensors, improving racing strategies and performance, demonstrating its broad applicability.
- Logistics: Delivery tracking, warehouse management, and supply chain operations.
- Finance and Insurance: Financial automation, fraud detection, and operational efficiency.
- Retail: Inventory tracking, customer experience improvement, and supply chain management.
- Healthcare: For real-time patient data analysis and monitoring.
Real Time Available Items:
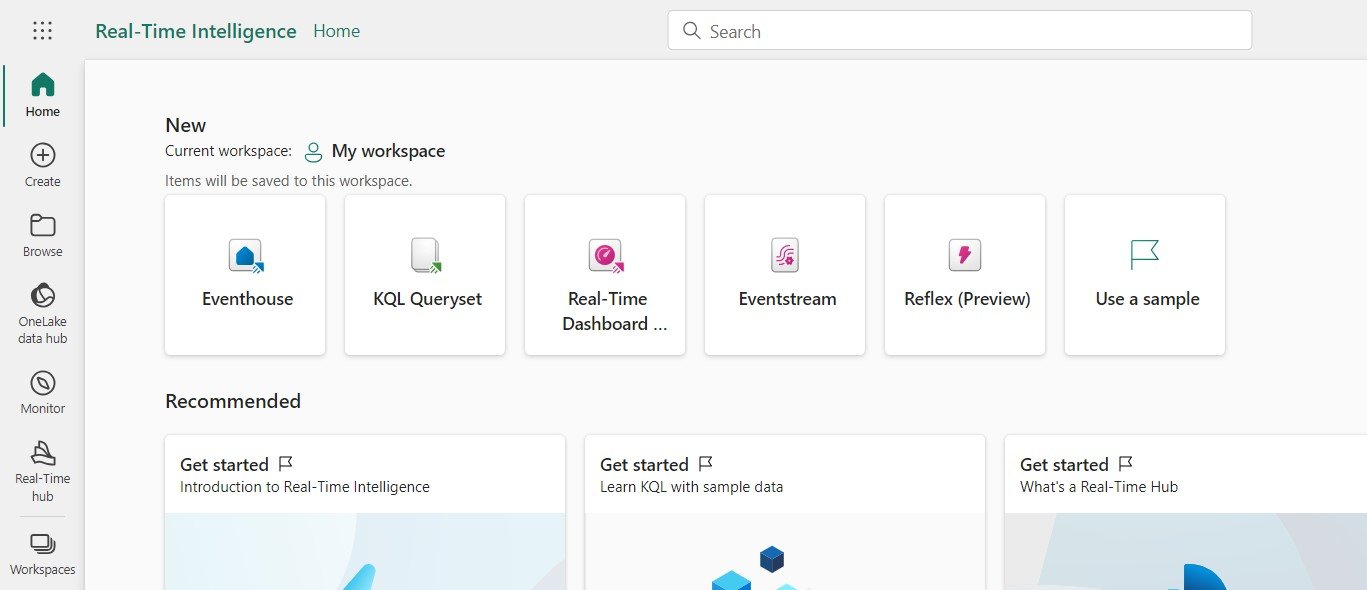
- Eventhouse: It is a database workspace to easily load structured, unstructured and streaming data for queries which allows managing and analyzing large volumes of data, in real time in an efficient way.
- KQL Queryset: Used to run queries on the data to produce shareable tables and visuals.
- Real-Time Dashboard (preview): Enables users to interact dynamically with their real time data, offering a wide range of visualizations customizable with conditional formatting rules. Users can easily slice and dice data, filter visuals, and explore different views using parameters and cross-filtering. The intuitive, codeless interface allows users to drill down into their data without needing specialized KQL knowledge.
Power BI vs Real Time Dashboard Reporting

In summary, choose Real-Time Dashboards for real-time data access and exploration, optimized for high-volume, fast-flowing data, and easy to use without KQL expertise and Power BI for complex reporting and analysis, supporting multiple data sources and extensive customization.
- Eventstream: Used to capture, transform, and route real-time event stream to various destinations in desired format with no-code experience.
- Reflex: Monitor datasets, queries, and event streams for patterns to trigger actions and alerts.
- Use a sample: Used to create a sample.
Real-time intelligence is a crucial part of the journey of data engineers and data analysts. This experience enables data analysts to expand the scope of their analytical capabilities by handling real-time scenarios with high velocity, low latency, meeting the growing business demand for instant and actionable information. If you want to delve deeper into the world of real-time data analytics, at the end of this series I will provide some resources and tips to help you begin to master these new skills.
Business Intelligence Experience – Power BI
Power BI is now a fully integrated component of Microsoft Fabric, this integration allows for seamless data leveraging, enabling users to quickly and intuitively achieve data-driven decisions.
Each serving unique purposes. Power BI focuses on data visualization and reporting, making it ideal for users needing intuitive, interactive dashboards and reports. Microsoft Fabric, on the other hand, offers an end-to-end data management solution, integrating advanced analytics, machine learning, and real-time data processing, making it suitable for comprehensive data science and engineering needs. Both tools complement each other, enhancing the overall capabilities available to data analysts, scientists, and decision-makers.
Choosing between them depends on your organization’s specific needs—whether you require powerful visualization tools or a holistic data management and analytics platform.
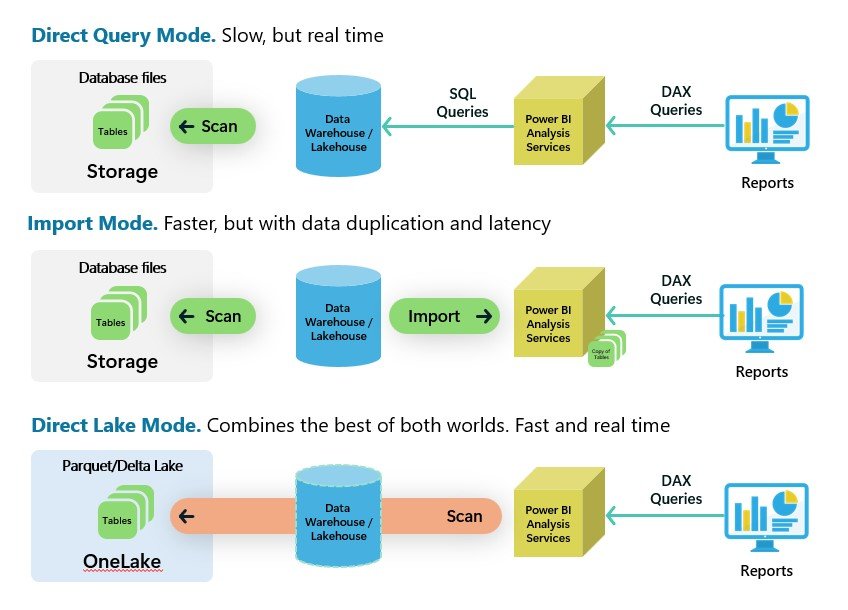
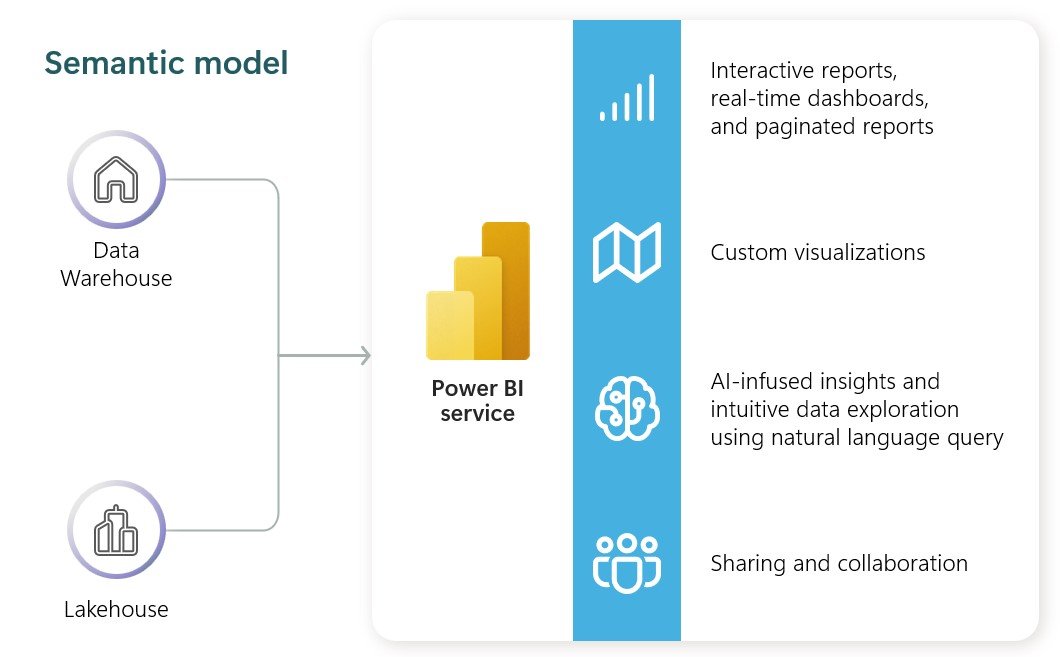
Power BI data models centralize data from multiple sources into a ready-for-reporting semantic model. There are three traditional types of data models:
- Import Mode: Data is stored or cached inside the data model. The source is only touched during refresh time, providing exceptional performance but with some data latency.
- DirectQuery: Only metadata is stored in the data model. When a report is used, queries are generated and executed against the source system, ensuring up-to-date data but potentially impacting report performance.
- Composite: Combines tables in both import mode and DirectQuery mode within the same report.
New Direct Lake
Direct Lake is a new type of dataset introduced in Microsoft Fabric. It combines the performance benefits of import mode and DirectQuery by reading data directly from Delta files within the lakehouse and data warehouse. This eliminates ingestion time, refresh schedules, and data latency ensuring real-time data access with optimal performance. Note that Direct Lake requires Power BI Premium P or Fabric F SKU capacities.
Power BI Available Items:

- Power BI Report: You can build Power BI reports directly from the Power BI experience or from various Fabric experiences. Reports can be created using data from Fabric lakehouses, data warehouses, SQL endpoints, and more.
Data Activator Experience
Data Activator is a no-code solution designed for automatically taking actions when patterns or conditions are detected in changing data, enabling business users to set up automated alerts and workflows without the need for IT or developer intervention.
Common Uses Cases:
- Sales and Marketing: Triggering ad placements based on sales data.
- Maintenance: Automating preemptive maintenance actions from sensor feedback.
- Inventory Management: Alerting store managers about inventory issues.
- Logistics: Tracking shipments and driver statuses.
- Customer Tracking: Monitoring customer journeys.
- Data Quality: Ensuring the integrity of data pipeline
Data Activator Items:
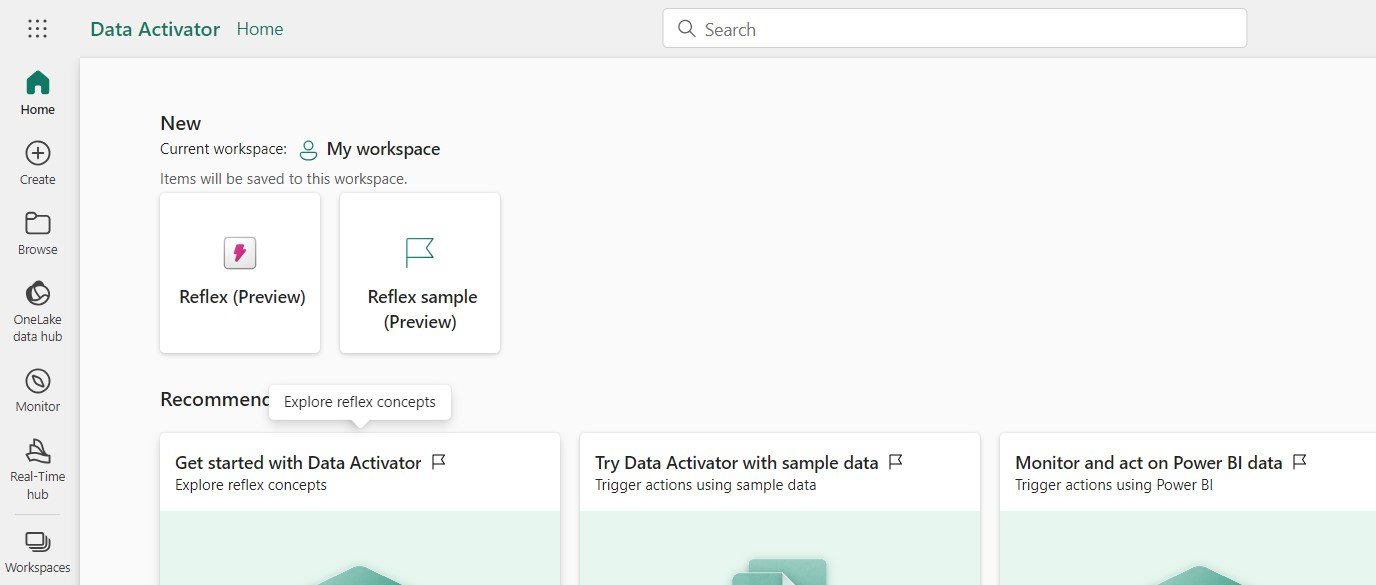
- Reflex: Used to monitor datasets, queries, and event streams for patterns.
- Reflex sample: You can monitor datasets, queries, and event streams for patterns to trigger actions and alerts with sample data.
Microsoft Fabric is designed specifically for the AI era, providing a comprehensive analytics solution as a single SaaS platform. In this chapter, we have explored the various workloads, such as Data Factory, Data Engineering, Data Warehouse, Data Science, Real-Time Analytics, Data Activator, and Power BI. Together, these workloads provide a unified experience for building robust and scalable analytics solutions.
With this foundation, you are now ready for the next article, in which I will present a complete Fabric solution focused on Power BI data analysts.

