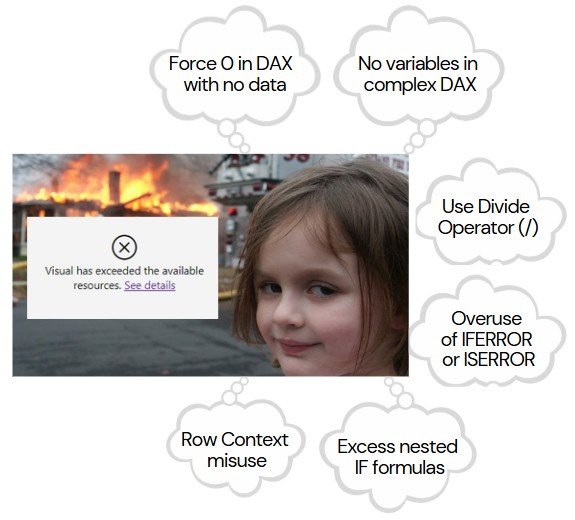
Addressing performance issues in Power BI can feel like solving a detective case. Performance bottlenecks can arise at any stage of the development process, and identifying their root cause, whether it’s slow reports, long refresh times, or unresponsive visuals, requires a systematic and structured approach.
For instance, a slow-loading report might be caused by:
- Inefficient data source queries
- Poorly designed data models
- Non optimized DAX calculations
- Reports overloaded with many visualizations
These are just a few examples. Performance issues can come from any part of the Power BI solution:
✅ Data Source Connection and Transformation
✅ Data model.
✅ DAX formulas.
✅ Data visualization.
✅ Environment: Infrastructure, deployment, and network.
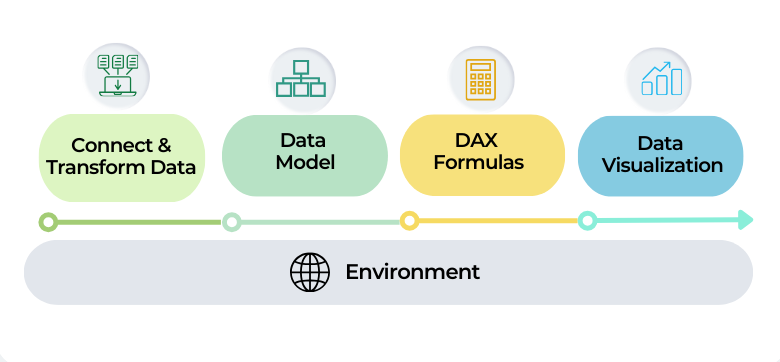
This series provides a comprehensive roadmap for auditing and optimizing Power BI solutions. These strategies are the same ones we use with our clients to identify bottlenecks and ensure their Power BI solutions are fast, efficient, and scalable.
Optimizing Data Source Connection and Transformation
In this first article, we’ll cover best practices for optimizing data connections and transformations, focusing on techniques such as query folding, connection modes, and data reduction. Properly handling this stage reduces loading and refresh times, minimizes the amount of data processed optimizing memory and CPU usage, while ensuring that only relevant and necessary information flows into your Power BI reports.
1. Reduce Data Volume and Granularity
Although these techniques are often associated with data model optimization, I include them here to emphasize the importance of adopting these best practices up front, during the phase of connecting and transforming data. In this way you can ensure that only the necessary data is loaded into the model, which reduces memory usage, improves processing speed and lays the foundation for an efficient data model.
Load Only Necessary Tables in Your Data Model
When building a data model, you may need to import tables into Power Query for intermediate calculations. However, if these tables are not required for your final reports, it’s important to prevent them from unnecessarily increasing the model’s size and complexity. To do this, remember to uncheck the “Enable Load” option in Power Query for any tables that serve only as intermediate steps and are not used in your reports:
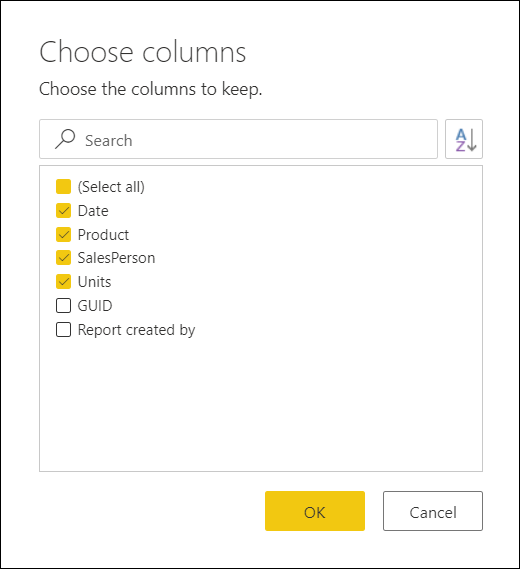
Only include the essential columns needed for analysis or visualization
Each column increases the processing and memory usage. Exclude columns like GUID, audit logs, or metadata that aren’t required for analysis. Keep this principle in mind: it is much easier to add columns later than to delete unnecessary ones. As the data model grows and more reports are connected to it, removing unused columns or tables becomes increasingly complex.
Split high cardinality columns
High cardinality (many unique values) in columns can significantly increase the size of your data model and slow down DAX calculations. Splitting these columns into smaller components improves compression, reduces memory usage, and enhances performance.
Best Practices
- Split Decimal Columns: Separate the integer and fractional parts of a decimal column into two columns.
- Split Datetime Columns: If both date and time are required, split datetime fields into two separate columns.
- Split High-Cardinality IDs: Columns like
TransactionIDorUserIDoften contain unique identifiers that are often composed of multiple meaningful components (e.g., prefixes, regions, or batch numbers). These columns can be split extracting meaningful components from the IDs and store them in separate columns. This helps reduce the unique values within each column, improving compression and performance. For example:

Filter Data Early
Apply filters in Power Query to load only relevant rows. For example, filter by dates or regions before importing.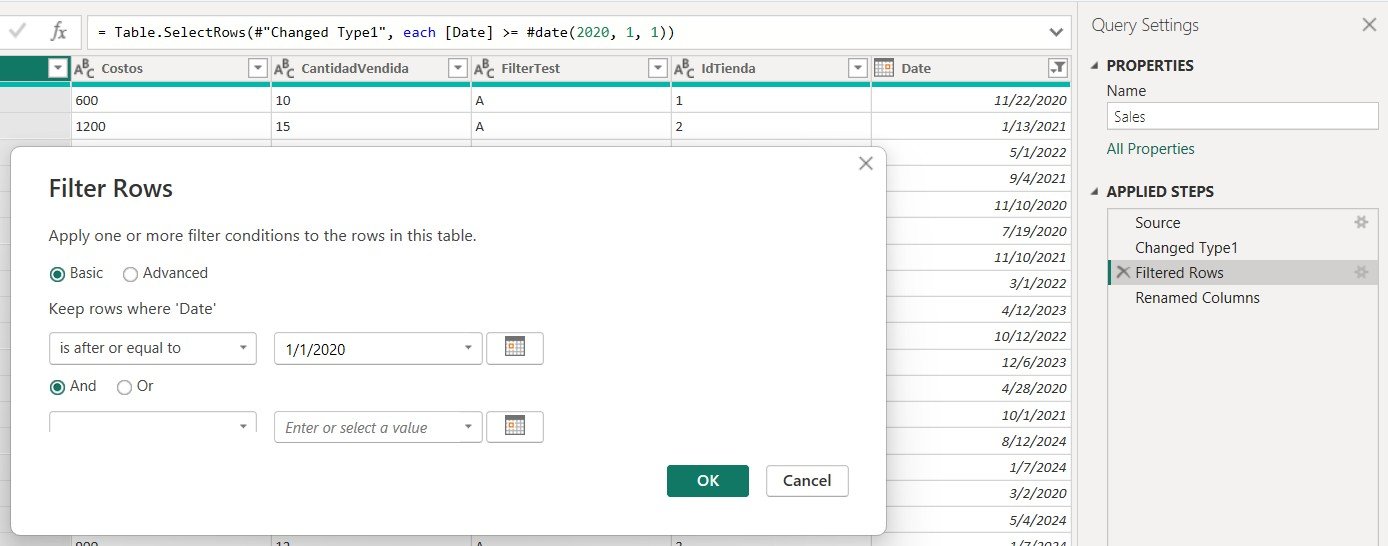
Reduce Granularity with Aggregations
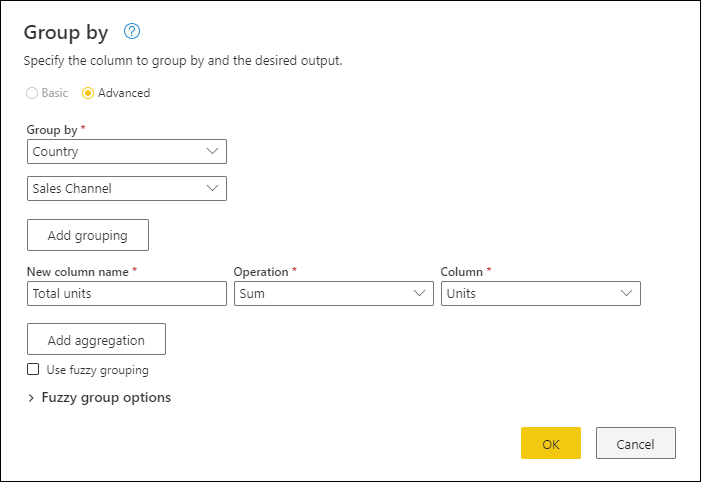
Reducing granularity is a powerful technique to optimize data size before loading it into the model. You can use tools like Power Query or SQL at the source to group and summarize data. For example, a sales table storing individual transaction lines can be aggregated by customer, product, or month. However, this trade-off sacrifices detailed transactional data for a more efficient model. Ensure your aggregation level meets the analytical needs of your reports.
2. Avoid Complex Transformations in Power BI
Perform heavy transformations at the data source using ETL tools, database views, or stored procedures. This reduces computational load on Power BI, optimizes refresh times, and ensures efficient, scalable solutions.
3. Optimize column data types
Use the most efficient data type, for example:
- Convert text or large data types (like strings) to smaller types where appropriate, such as integers or booleans.
- Avoid using high-precision decimals if not necessary, opt for fixed decimal or whole numbers.
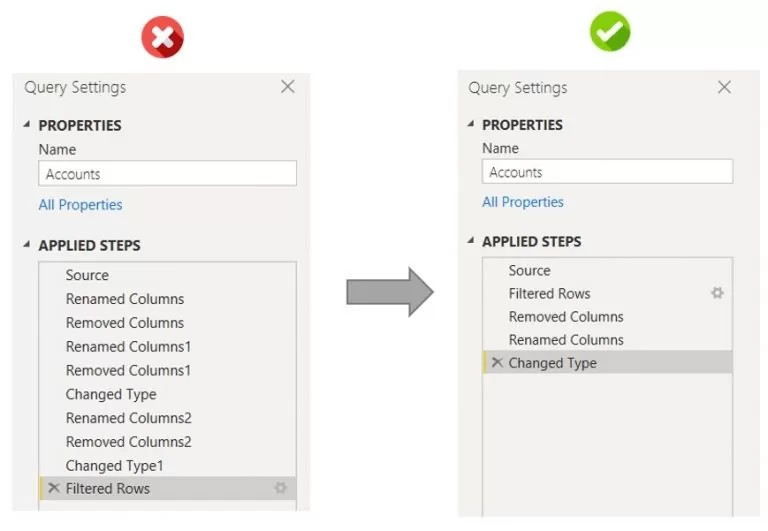
4. Consolidate Applied Steps in Power Query
Combine similar transformations, such as renaming or removing multiple columns in one step, to avoid redundant processing.
5. Leverage Query Folding
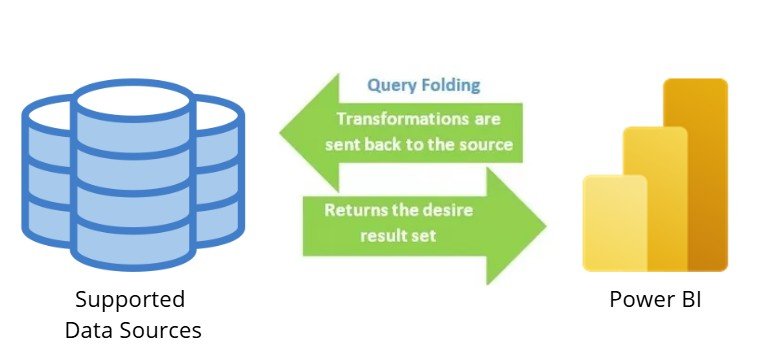
Query folding delegates transformations to the data source, optimizing performance by reducing local processing. It is supported by relational databases (e.g., SQL Server, Oracle), cloud databases (e.g., Snowflake, Amazon Redshift), OData sources (e.g., SharePoint lists), and Active Directory. However, it is not available for flat files (e.g., Excel, CSV), blobs, or web sources, where all transformations are handled locally.
How to Check Query Folding
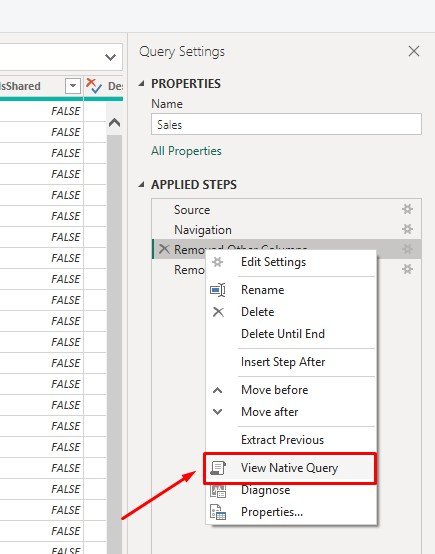
- In the Power Query Editor:
- Right-click a step in the Applied Steps pane.
- If View Native Query is enabled, folding is occurring for the step.
- If grayed out, folding is no longer occurring, and that step is being processed locally.
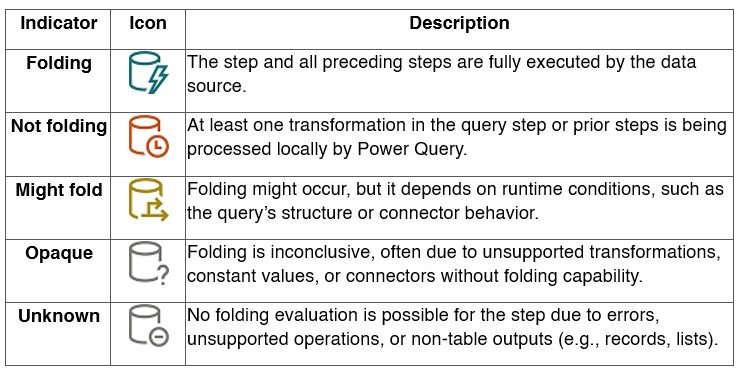
- Using Query Folding Indicators (Power Query Online):
- Leverage Query Plan View (Power Query Online):
- Use the Query Plan feature to visualize which steps fold back to the data source and which are processed locally.
- Review folded and non-folded nodes to optimize query design.
Good Practices for Query Folding
- Achieve Full Query Folding Whenever Possible: The goal of fully folding is to ensure that all necessary transformations are executed by the data source rather than locally within Power BI. By delegating all transformations to the data source, Power BI receives the final result set, reducing resource consumption and enhancing query speed.
- Partial Folding, In scenarios where full folding is not achievable, it is important to organize the query steps strategically:
- Place all transformations that support query folding at the beginning of the query.
- Move non-foldable steps to the end to minimize local processing.
- Use Native Queries with Folding: When using
Value.NativeQueryin Power Query, include all necessary transformations directly in the native query. Avoid Additional Steps After Native Queries as any additional transformations applied after the native query will not fold and will be processed locally, potentially reducing performance. - When Query Folding Is Not Possible: For queries requiring numerous non-foldable transformations, it is highly recommended to apply those transformations directly at the data source, as mentioned in Point 2, this can be achieved by leveraging ETL tools, database views, or stored procedures.
6. Power BI Settings
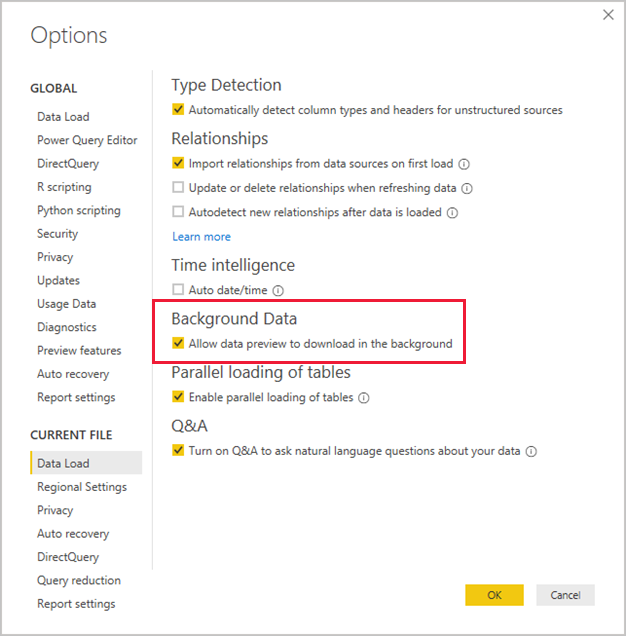
Disable Background Refresh
By default, Power Query in Power BI Desktop caches up to 1,000 rows of preview data for each query. While this preview data helps users quickly view source data and transformation results, it is stored separately from the Power BI Desktop file and can significantly increase refresh times, especially when working with many queries.
Go to Options > Current File > Data Load > Background Data > Enable the option: Allow data preview to download in the background.
Safely Ignore Privacy Levels
Privacy levels in Power Query define the isolation between data sources to control data visibility and prevent unauthorized data transfer. These levels are categorized as follows:
- None: No isolation; suitable for controlled environments but carries a risk of data leakage.
- Private: Ensures strict isolation for sensitive data, preventing merging with other sources.
- Organizational: Allows data sharing within trusted groups but not with public sources.
- Public: Accessible to all and can merge with other data sources.
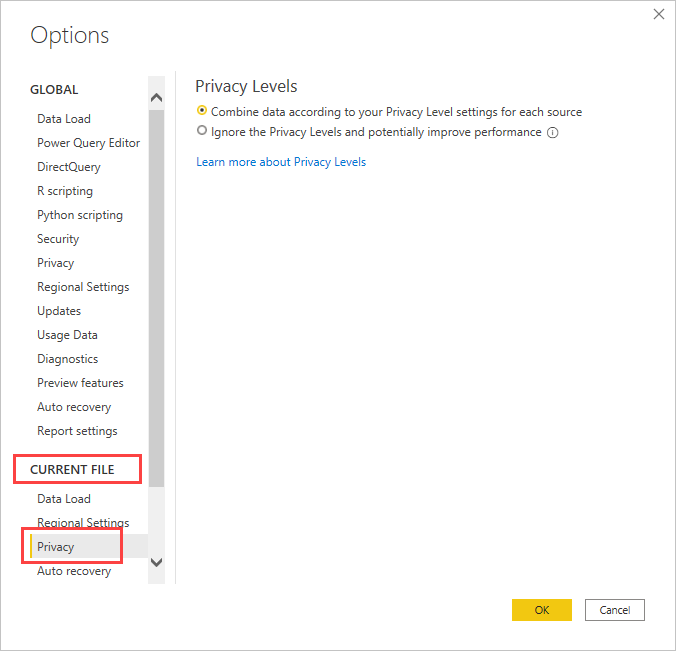
Selecting the option to ignore privacy levels can potentially improve performance. However, this could expose sensitive or confidential data to an unauthorized person. Don’t enable this setting unless you are confident that the data source doesn’t contain sensitive or confidential data.
Go to Options > Current File > Privacy > Select: Ignore the Privacy Levels and potentially improve performance.
Note: Ignored privacy levels won’t apply to reports in the Power BI Service.
Performance Analysis Tools
Query Diagnostics
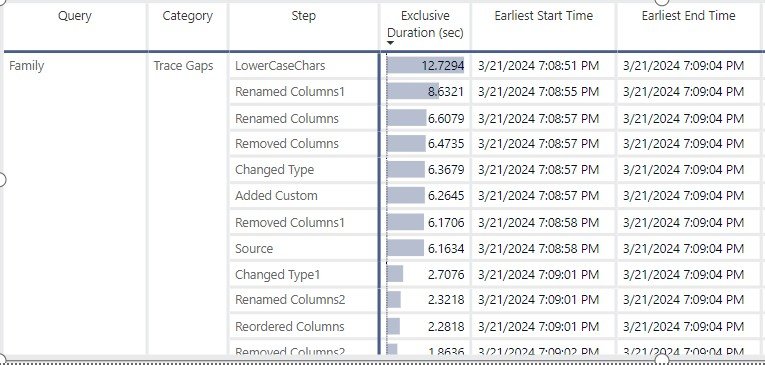
Query Diagnostics helps analyze the behavior of Power Query during data transformations, previewing, and refresh operations. It identifies slowdowns, explains background evaluations, and provides insights into how queries interact with data sources. It provides two types of Diagnostics:
- Summarized View: Provides a high-level overview of where time is spent during query execution, combining related operations.
- Detailed View: Offers line-by-line insights for advanced troubleshooting and performance tuning.
Steps to use Query Diagnostic:
1. In Power Query Editor, select Start Diagnostics from the Tools ribbon.
2. Perform actions (e.g., refresh preview or query) to capture performance data.
3. Analyze results in the diagnostics queries generated.

Tip: Focus on the Exclusive Duration column and summarize the values to understand which steps consume the most resources or take the longest time.
Conclusion
Optimizing data source connections and transformations is the first step toward creating high-performing Power BI reports. By reducing unnecessary data, leveraging query folding, and organizing query steps efficiently, you can lay the foundation for faster, more responsive, and scalable solutions.
👉 Clich here for part 2 of this series.


