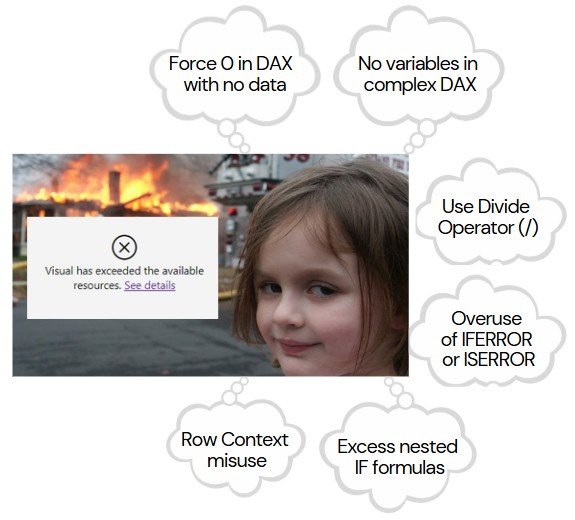
This second article is focused on best practices for designing your data model, adopting a star schema design, optimizing CPU, RAM, and workspace capacity consumption by minimizing memory usage.
1. Adopt a Star Schema Design
The star schema is a widely adopted design for creating efficient and user-friendly Power BI semantic models. It organizes data into fact tables for quantitative data (e.g., sales orders) and dimension tables for descriptive data (e.g., customers, products).
Benefits
✅ More user friendly.
✅ Simplifies both development and maintenance.
✅ DAX formulas are simpler.
✅ The time refreshes are faster.
✅ Reduces redundant data
Key concepts:
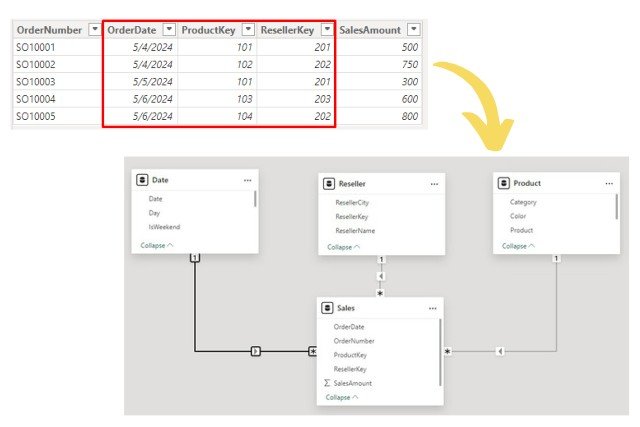
- Fact tables: Store numerical data and are connected to dimension tables via foreign keys.
- Dimension tables: Represent business entities, like products, customers, or regions, providing context to the data. Enable filtering and grouping, simplifying report generation.
- Granularity: Determined by the level of detail in your data. High granularity means the data is very detailed, such as individual transaction lines. While this provides in-depth analysis, it can significantly increase model size.
- Normalization vs. Denormalization
- Normalized: Reduces redundancy by splitting data into multiple tables (e.g., storing only keys in fact tables). Power BI prefers normalized models for efficiency
-
- Denormalized: Combines related data into single tables. Typically used for simpler data sources but less efficient.

2. Select the Appropriate Storage Mode
Power BI offers three storage modes, each suited to different use cases. Selecting the correct mode ensures optimal performance and scalability.
Import Mode:
- Fully caches data in-memory, offering the best query performance.
- Ideal for small to medium datasets that do not require near real-time updates.
- Recommended for datasets optimized for compression and frequent queries.
DirectQuery Mode:
- Queries data directly from the source without caching.
- Suitable for large datasets or real-time requirements.
- Requires optimized source-side queries to reduce latency.
Dual Mode:
- Allows a table to act as either cached (Import) or non-cached (DirectQuery) depending on the query context.
- Particularly useful for shared dimension tables in composite models.
- Enhances performance by reducing the number of limited relationships and optimizing queries.
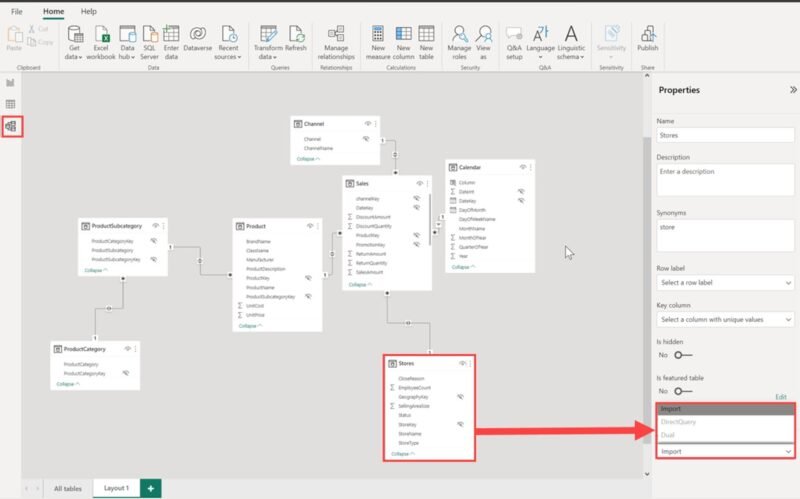
I recommend that you review the advantages, disadvantages, and limitations of each in the Microsoft documentation so that you can select the correct one.
3. Remove unncessary tables and columns from your data model
Maintaining a simplified data model is essential for optimal performance. However, over time, data models often accumulate unnecessary columns and tables, leading to longer refresh times, increased complexity, and difficulties for users navigating the model. Cleaning up the data model becomes a critical task to ensure efficiency and usability.
Identifying and safely removing unnecessary columns can be challenging, especially when multiple reports are connected to the dataset. Deleting a column without proper analysis risks breaking dependent reports. To simplify this process, I’ve developed a free tool called Tabular Model Cleaner, which helps you quickly and safely clean your data models without disrupting existing reports.
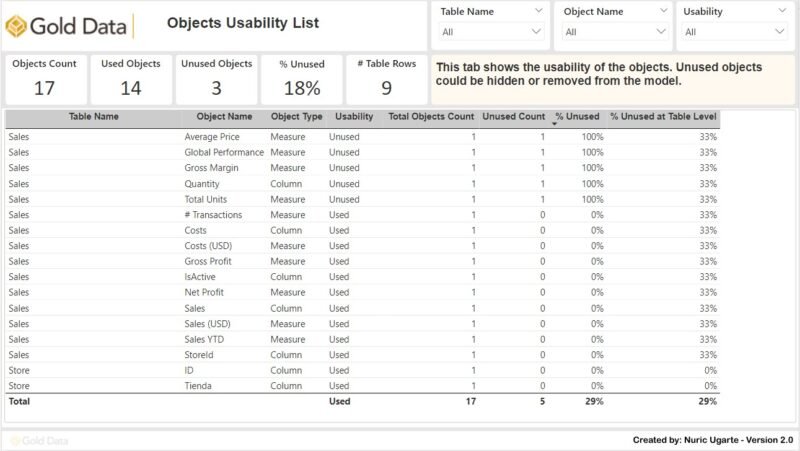
👉 Check it out here: Tabular Model Cleaner 2.0
4. Group By and Summarize your data
Grouping and summarizing data is a powerful way to reduce model size and improve performance. By pre-aggregating fact tables (e.g., by day, month, or customer), you can significantly decrease row counts and optimize resource usage.
While this reduces model size by up to 90%, it limits detailed analysis. A balanced approach is to use summary tables in Import mode for quick reporting and DirectQuery tables for detailed data. For example, you can use an Import mode table for quick summary reports (e.g., monthly sales) and a DirectQuery-mode table for in-depth exploration of individual sales orders. This combination ensures high performance while maintaining the flexibility to analyze finer details when necessary.
5. Partition Large Datasets with Hot and Cold Table Partitions
Hot and cold partitions in Power BI improve performance for large datasets by splitting tables based on data usage. Recent data (“hot”) is stored in Import mode for faster access, while older data (“cold”) uses DirectQuery mode to save memory and reduce import size.
Key Benefits:
- Faster queries for recent data that is accessed frequently.
- Efficient use of resources by maintaining access to historical data without importing it into the data model.
- Reduced data source load by minimizing pressure on data sources by querying only when necessary.
6. Optimize Relationships
Avoid many-to-many relationships
Where possible, avoid using many-to-many relationships in your data model, as they can complicate performance and introduce ambiguity in calculations. Instead, create a bridge table with unique values that connects the related tables and establish one-to-many relationships from the bridge table to the fact tables.
Avoid bi-directional relationship
Bi-directional relationships allow filters to propagate in both directions but should be used sparingly due to their potential negative impact on performance and user experience. Power BI modelers should carefully evaluate the necessity of bi-directional filtering and explore alternatives whenever possible to maintain optimal performance and a clear user experience.
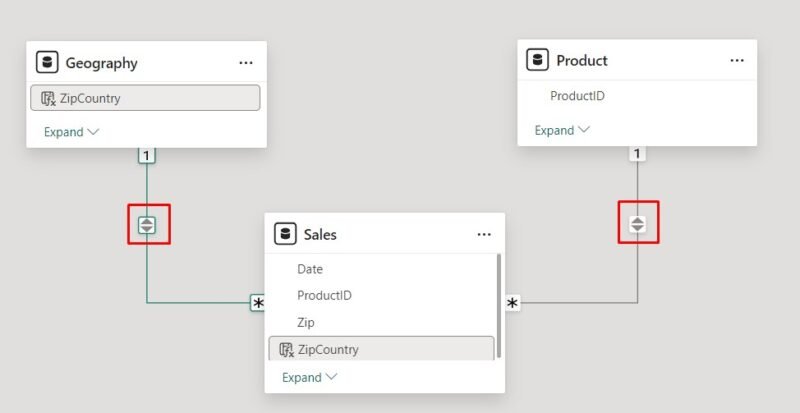
For instance, instead of creating bi-directional relationships, consider using the CROSSFILTER DAX function. This approach activates bi-directional filtering only within the scope of a specific calculation, reducing the broader performance impact associated with permanent bi-directional relationships.
Crossfilter example =
CALCULATE(
SUM(FactTable[ValueColumn]),
CROSSFILTER(FactTable[KeyColumn], DimensionTable[KeyColumn], BOTH)
)
7. Use a Date Table
A well-designed date table is essential for time intelligence calculations and simplifies model interactions.
Best Practices:
- Use a pre-built date table with a continuous range of dates instead of the auto-generated hierarchy in Power BI.
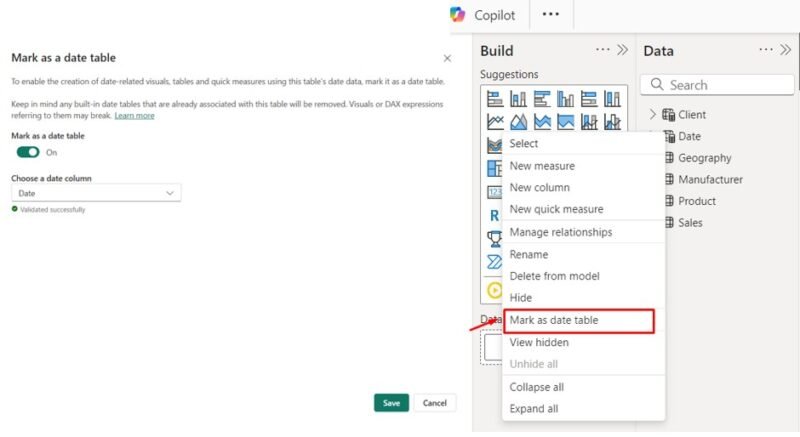
- Mark the date table as a date table for better functionality.
- For role-playing dimensions (e.g., Order Date, Ship Date), duplicate the date table or use DAX measures to handle multiple roles.
8. Optimize Data Load with Incremental Refresh
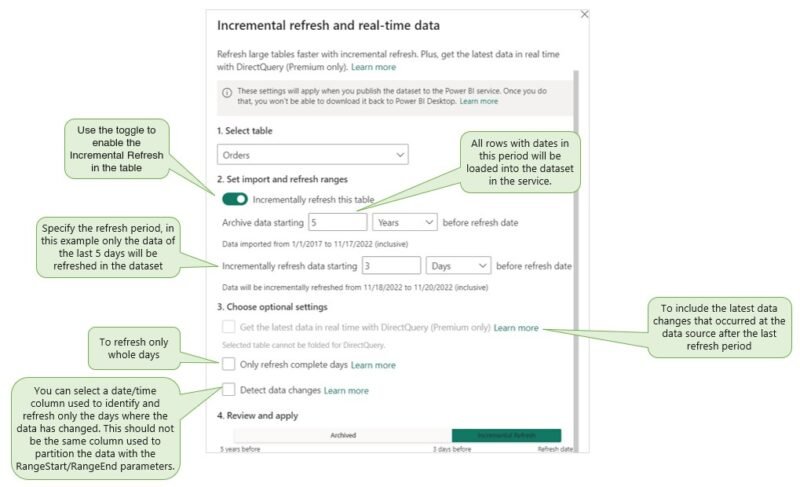
For larger datasets, full refreshes can become time-consuming and resource-intensive. Configuring incremental refresh allows Power BI to refresh only new or changed data, significantly improving efficiency.
Set Up Incremental Refresh:
- Define parameters such as RangeStart and RangeEnd in Power Query
- Filter Data by date or time, and configure the dataset for incremental loading.
9. Power BI Settings
Disable Power BI’s auto-date/time hierarchy
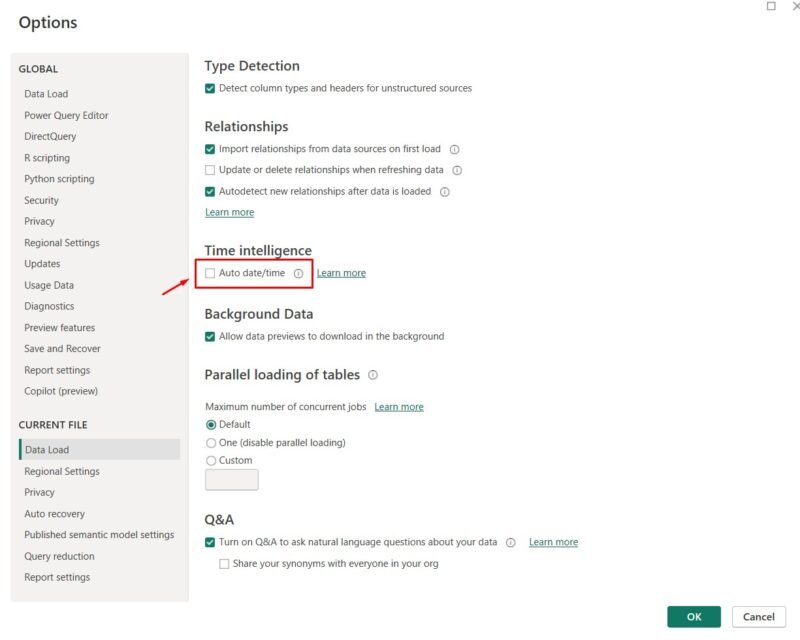
Disable Power BI’s auto-date/time hierarchy for better control and to reduce model size. Instead, use a custom Date table with manual hierarchies.
Go to Options > Current File > Data Load > Time Intelligence > Disable: Auto date/time.
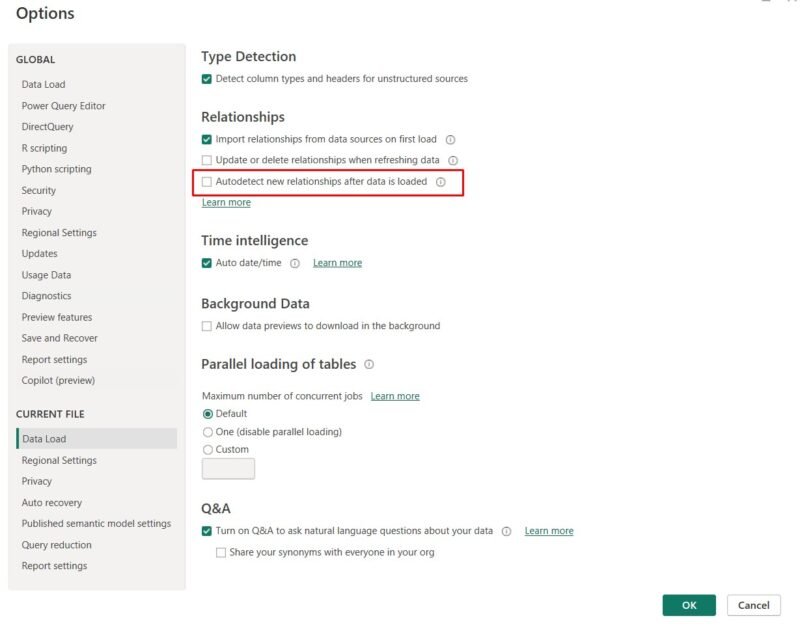
Disable the “Autodetect new relationships after data is loaded” option
This feature can unintentionally create relationships that may disrupt your data model, especially if you lack extensive experience in data modeling.
Go to Options > Current File > Data Load > Relationships > Disable: Autodetect new relationships after data is loaded.
Performance Analysis Tools
Here is a list of tools to help you analyze the performance of your data model. Some are built-in features, while others are free and open-source solutions.
DAX Studio
Analyze query performance, memory consumption, and inefficient measures.
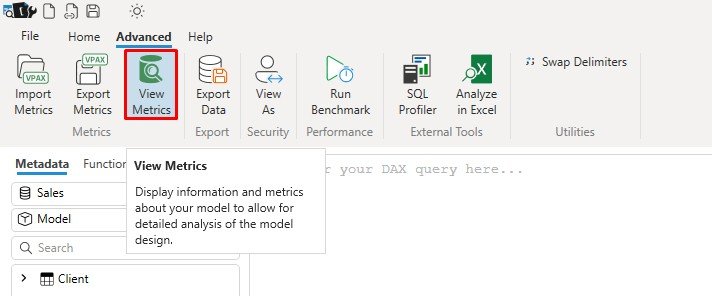
1. Launch DAX Studio: Open DAX Studio and connect to the Power BI model you want to analyze.

2. View Metrics: Navigate to the Advanced tab and click on “View Metrics.” This provides detailed insights into the model’s performance and structure.
Key Metrics to Analyze:
Cardinality: Represents the number of unique values in a column. High-cardinality columns, especially in string or date/time formats, can significantly impact performance.
Recommendations:
-
- Remove unnecessary high-cardinality columns like GUIDs and timestamps.
- Split
Datetimecolumns into separateDateandTimecolumns to reduce cardinality.
Size Information: Displays the memory usage of each table and column in the model, helping you identify where the most memory is being consumed. Focus on removing non-essential columns, especially those that occupy significant space, to reduce the size of your data model.
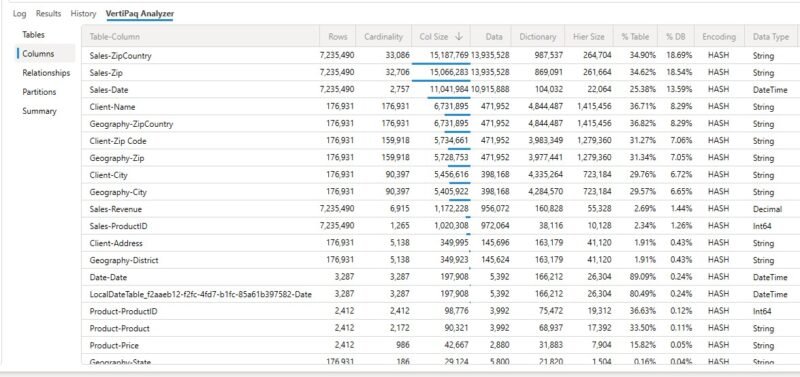
Summary Information: Located under the Summary tab, this section provides an overview of the model, including its total size, as well as the number of tables and columns it contains.

Tabular model cleaner 2.0
Tabular Model Cleaner 2.0 is a free, user-friendly tool designed to to analyze the impact in your reports of make changes or removing objects from your data models. With this tool, you can:
- Detect which measures, columns, and tables are unused in your connected reports and decide whether to keep, hide, or delete them.
- Detect dependencies in complex calculations, ensuring you don’t remove objects crucial to your measures or columns.
- Organize your models, improve performance, and reduce refresh times by removing unnecessary clutter.

Tabular Editor’s Best Practice Analyzer
The Best Practice Analyzer in Tabular Editor elps users validate whether their Power BI models apply performance best practices. It analyzes models for potential problems, provides practical feedback, and offers tools to troubleshoot problems directly or generate scripts for later use.
Bravo
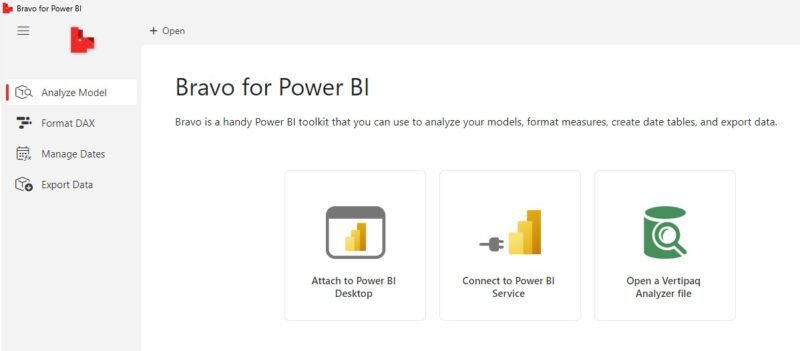
Use Bravo to quickly analyze where your model consumes the most memory and choose which columns to remove to optimize it. You can also use Bravo to export your metadata to VPAX files.
Conclusion
By following these data modeling best practices, you ensure that your Power BI solutions are not only performant but also scalable, easier to maintain, and user-friendly. A well-designed data model is critical for delivering fast and responsive reports while minimizing the use of system resources like memory and CPU. Regularly review and optimize your model to adapt to evolving business needs and dataset growth.
👉 Clich here for part 3 of this series.


