I am thrilled to announce the release of Tabular Model Cleaner 2.0, a tool I’ve developed to simplify and optimize Power BI and Fabric semantic models. As data models grow, they often accumulate unused columns, tables, and measures, resulting in unnecessary complexity, slower refresh times, and degraded performance.
Cleaning unused objects manually is a time-consuming and challenging task, especially with large models connected to multiple reports. The risk of accidentally removing an object in use and breaking downstream reports adds further complications.
Tabular Model Cleaner 2.0 is a free, user-friendly tool designed to solve these challenges. With this tool, you can:
- Identify Unused Objects with prevision: Automatically detect which measures, columns, calculated columns, and tables are being used in your connected reports and which are not. This enables you to make informed decisions about whether to keep, hide, or delete objects.
- Analyze Nested Dependencies: Detect dependencies in complex calculations, ensuring you don’t remove objects crucial to your measures or columns.
- Optimize Your Model Safely: Organize your data model without breaking connected reports.
- Boost Performance: Organize your models, improve performance, and reduce refresh times by removing unnecessary clutter.
What’s New in Version 2.0?
Here are the key improvements in this latest release:
- Correct handling of partitioned tables: Previously, all partitions were treated as separate entities, leading to data duplication in analysis. Now the tool recognizes and correctly manages partitioned tables.
- Nested Measure Dependencies: In the previous version, the tool only detected the first level of dependencies between measures. Now, it can track dependencies down to the deepest level, ensuring that all columns and measures involved in complex nested calculations are correctly identified.
- Enhanced Filter Detection: The tool now detects fields used in report, page and visual filters.
How It Works
The tool consists of two core parts:
-
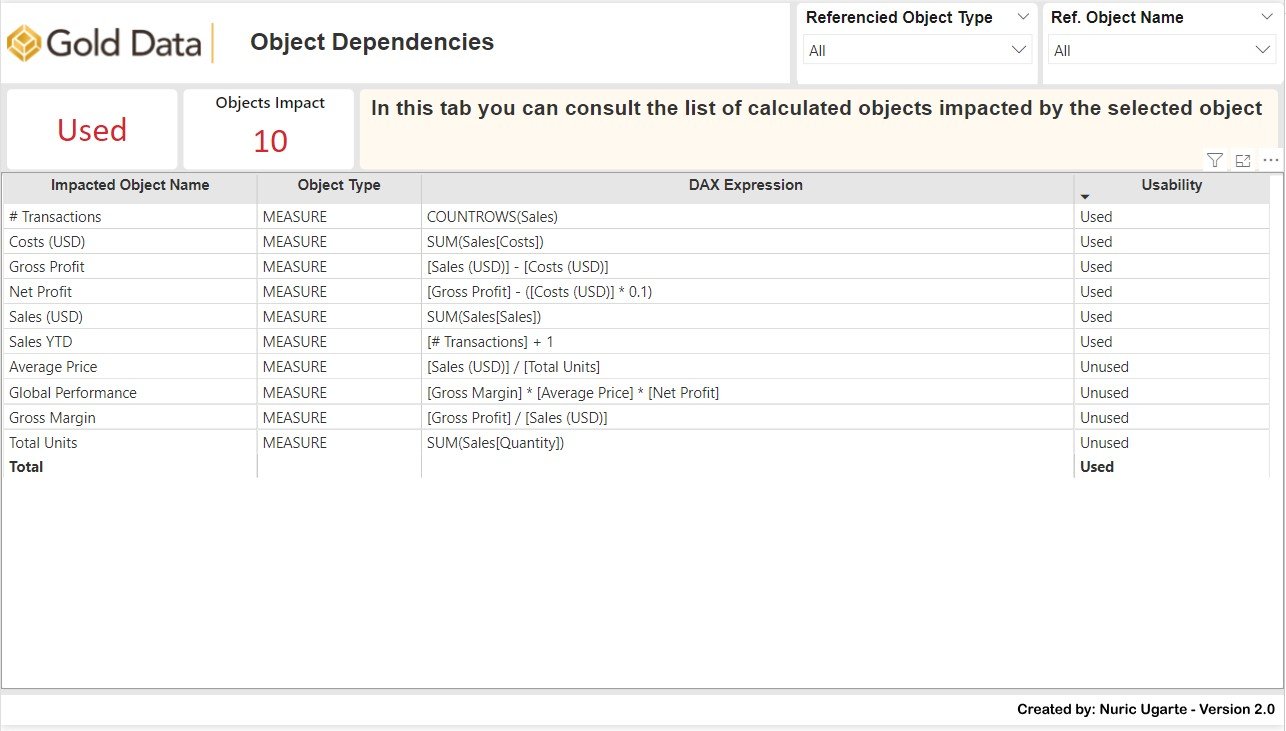
Object Dependencies
Using Dynamic Management Views (DMVs), particularly the DISCOVER_CALC_DEPENDENCY view, the tool maps out the relationships between objects in the tabular model. This allows you to visualize how one object influences others and assess the impact of removing it.
Additionally, the tool includes a custom Power Query function that builds a hierarchical dependency tree for measures. This ensures that columns used indirectly in lower levels of measure hierarchies are accurately identified.
-
Object Usage in Reports
With Report Analyzer, the tool scans your Power BI reports to identify:
- Visual elements.
- Report-level measures.
- Filters (page, visual, and report-level).
- Bookmarks.
It combines this information with the dependency data from DMVs to create a comprehensive view of object usage across connected reports.
How to Use the Tool
Follow these steps to get started:
Step 1: Connect to Your Dataset
For Local Power BI Datasets:
- Open the Power BI dataset you want to analyze.
- Open DAX Studio and select the “PBI / SSDT Model” data source option, then click Connect.
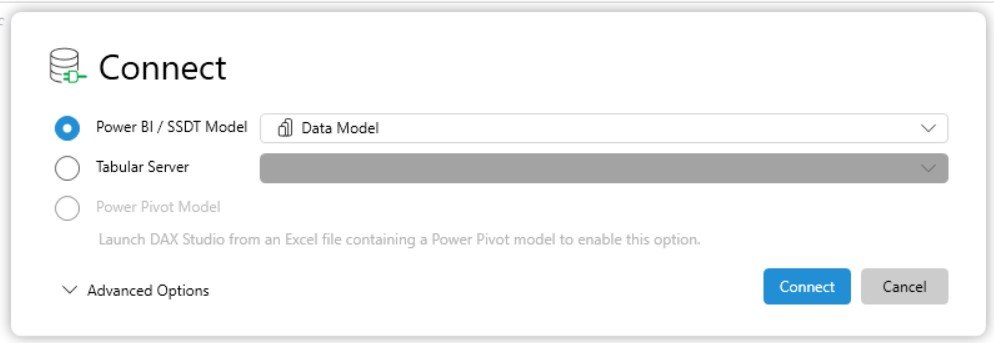 Locate the server name and port in the lower-right corner (e.g., localhost:52223).
 Run the DMV query SELECT * FROM $SYSTEM.DBSCHEMA_CATALOGS in DAX Studio to get the database GUID:

Power BI Premium
- Navigate to Workspace Settings in your Power BI Premium environment.
- Server: In workspace Settings > Premium > Workspace Connection, select Copy.
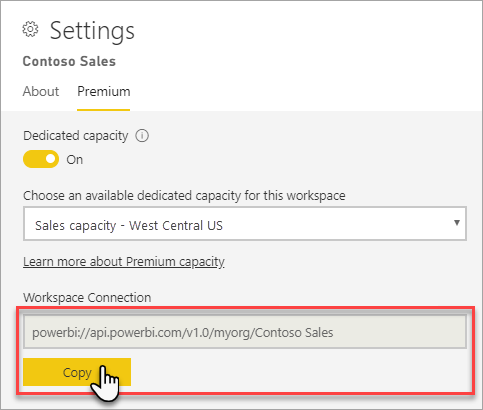
3. Database: This is the name of the dataset.
Microsoft Fabric Semantic Models:
- Navigate to Workspace Settings in your Fabric environment.
- Server: Go to License Info and copy the connection link.
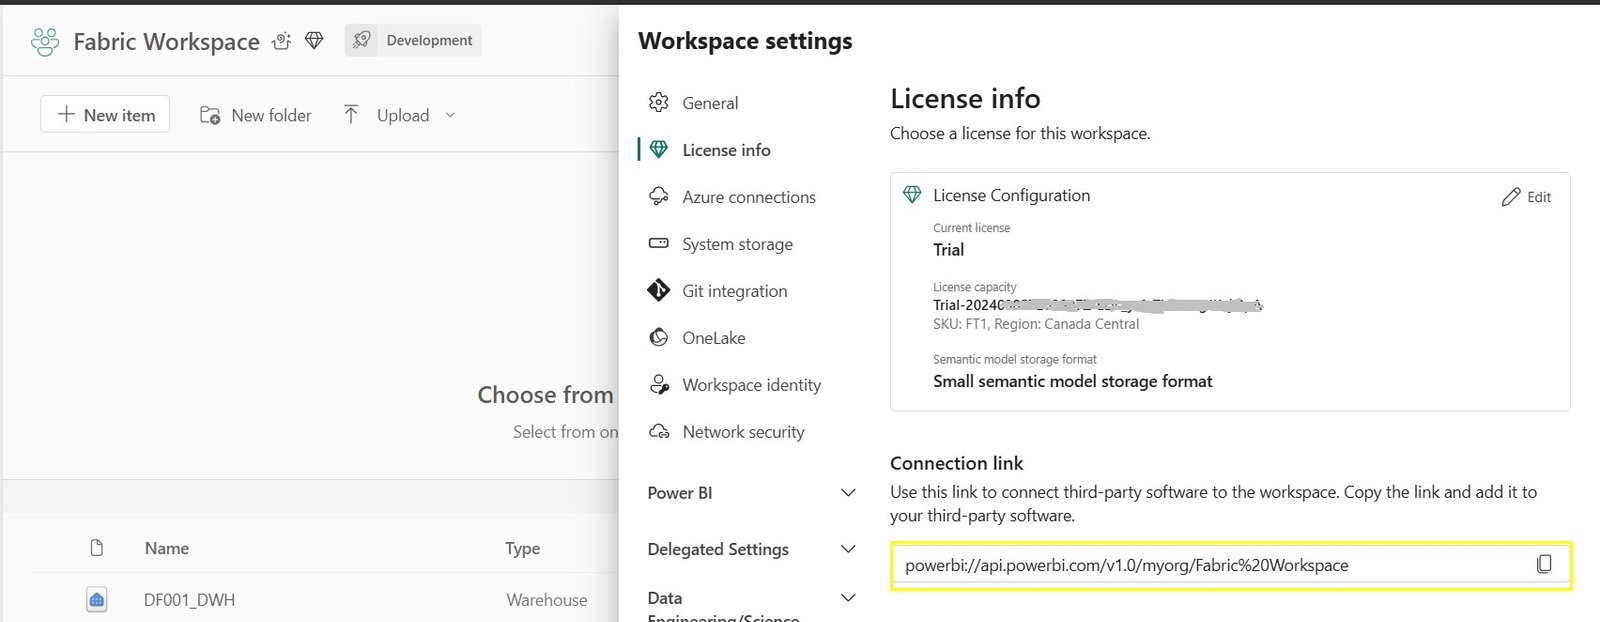 Database: Use the semantic model name as the database name.
Step 2: Extract Report Metadata
- Save all Power BI report files connected to the golden dataset in a folder.
- Open Report Analyzer (an external tool) which allows to extract metadata from connected reports.
 Select the folder containing the reports and choose Export Report Metadata.
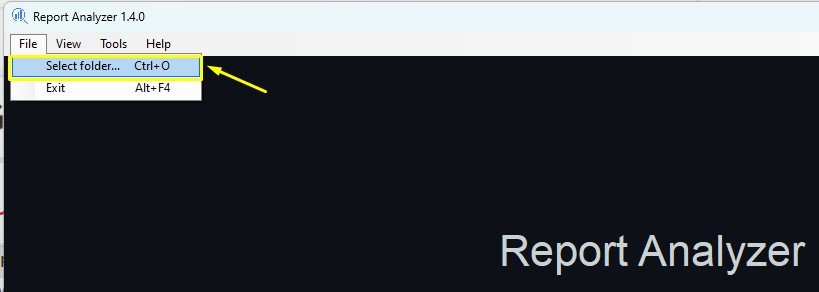
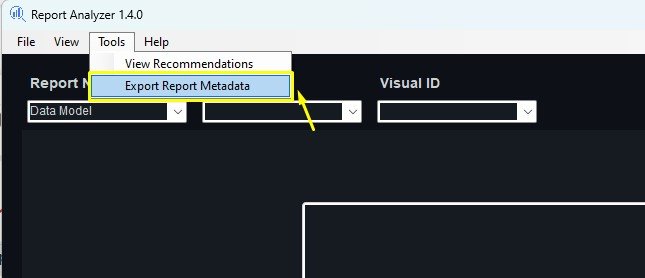
4. This generates .txt files with report metadata in the same folder.
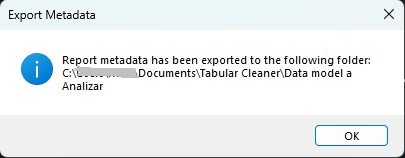
Step 3: Update Tool Parameters
- Open the Tabular Model Cleaner tool.
- Update the Dataset Server and Dataset Database parameters with the connection details retrieved in Step 1.
- Finally, update the LocalSourcePBITemplates parameter in Power BI to point to the folder where the .txt files generated by Report Analyzer in Step 2 are saved.
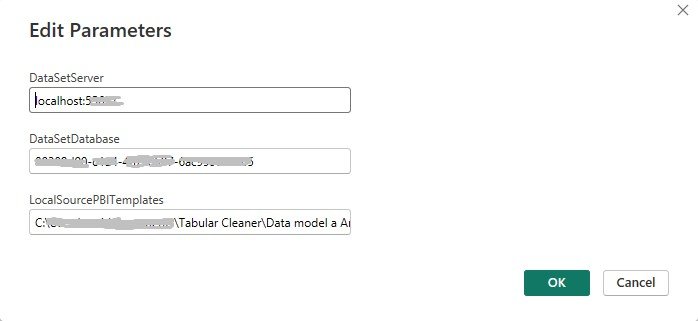 Refresh the data model cleaner tool to load the report metadata.
Information Provided by Data Model Cleaner
-
Object Dependencies
Visualize how objects impact each other within the model.
- Impact Analysis: Review the measures, columns, or calculated objects affected by the selected object.
- Usability Status: Determine whether an object is “Used” or “Unused” in connected reports.
-
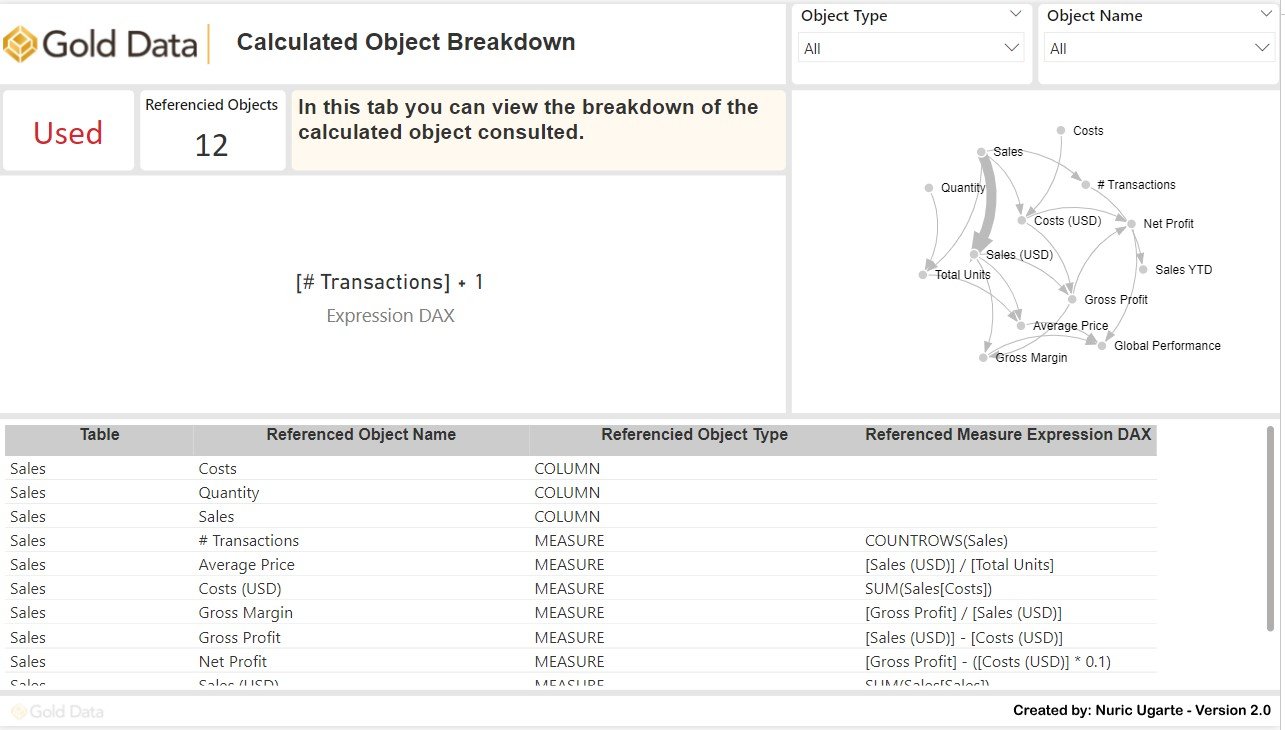
Calculated Object Breakdown
Dive into the dependencies of a selected object.
- Expression Analysis: View the DAX formula for the selected object.
- Dependency Graph: Understand the relationships between objects in a visual format.
- Referenced Objects Table: Examine the tables, measures, or columns used by the selected object.
3. Object Usability List
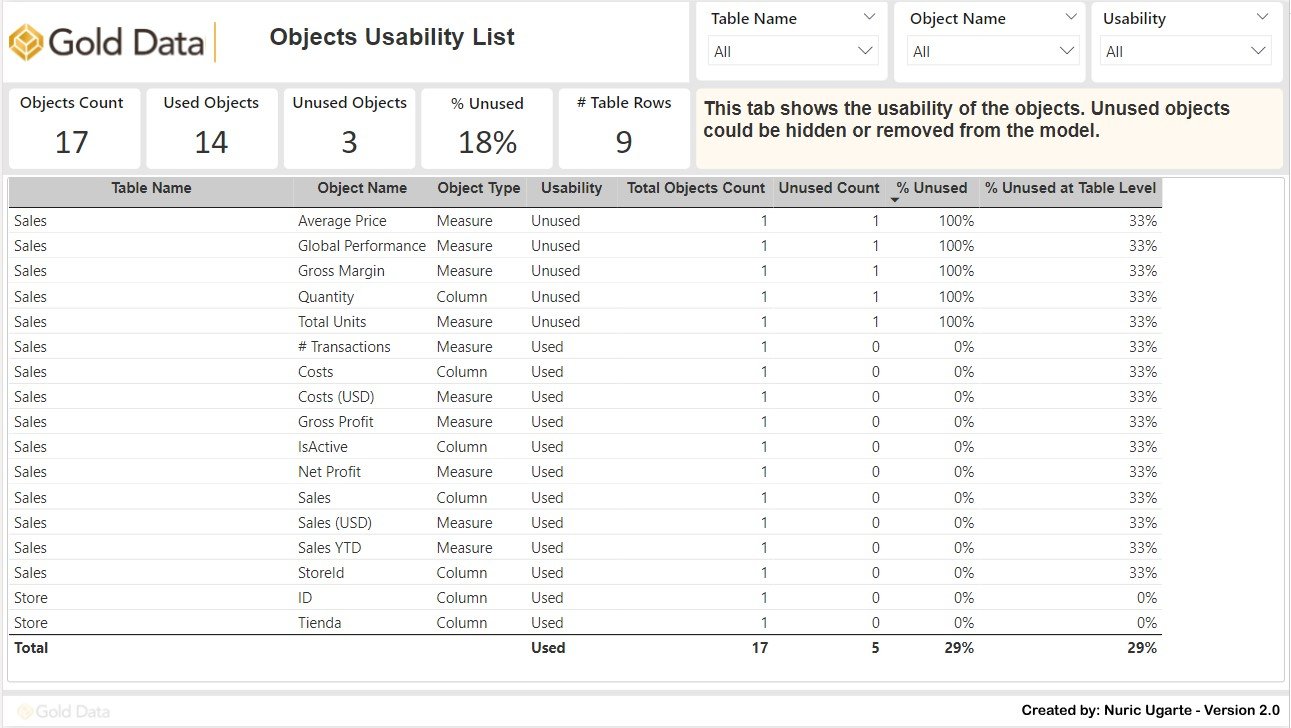
This tab provides an overview of the usability of all objects within the data model. It is designed to help you identify and manage unused objects. This tab helps you make informed decisions about which objects can be hidden or removed to improve performance and simplify your model without disrupting functionality.
-
- Usage Statistics: See the total, used, and unused object counts across your model.
- Unused Percentage: Understand how much of each table remains unused, helping you prioritize cleanup efforts.
4. Object Utilization in Reports
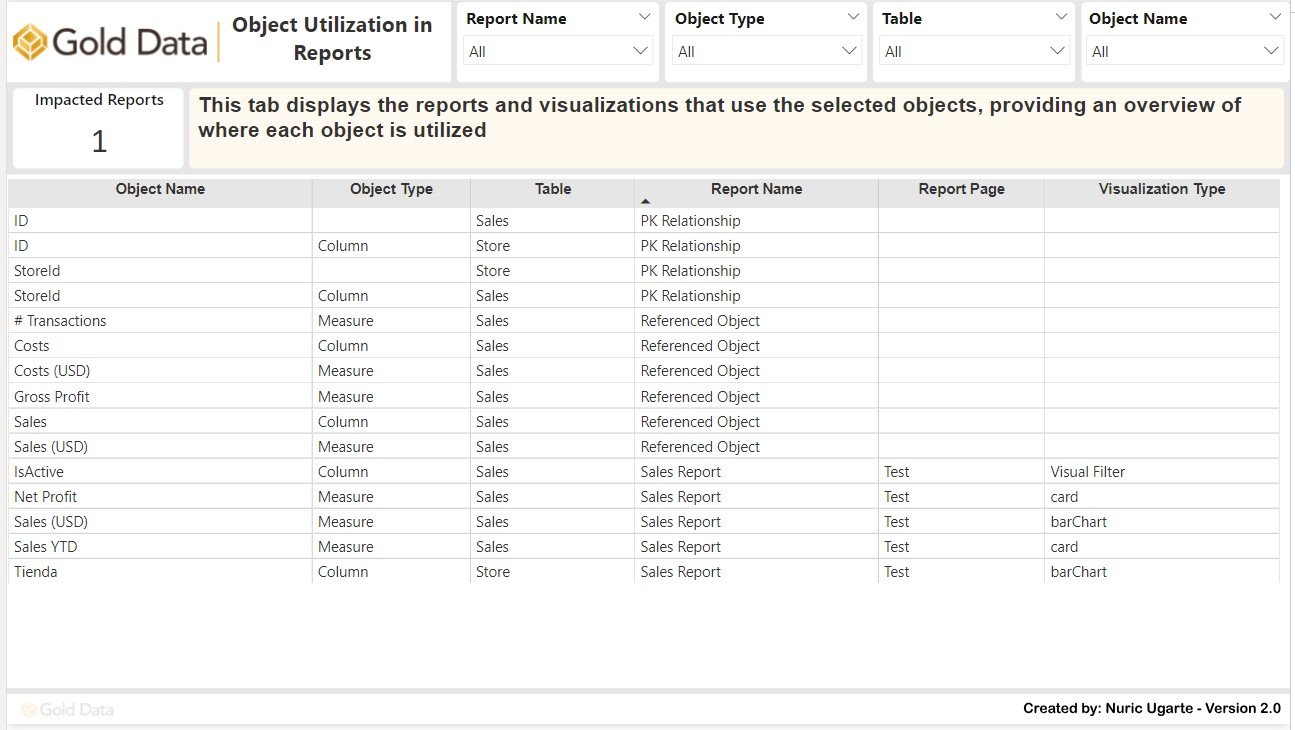
This tab provides a detailed view of how and where each object in your data model is utilized across connected reports.
- Report-Level Usage: Identify the reports, pages, and visuals that rely on specific objects.
- Visualization Types: Determine how objects are being used (e.g., slicers, tables, cards, charts, etc.).
Key Considerations When Cleaning Up Models
- Ensure all dependencies are traced: Nested dependencies, indirect usage, and filters should all be accounted for.
- Backup your dataset: Before removing any objects, create a backup to prevent accidental loss of critical data.
- Include All Connected Reports: Ensure that all reports connected to the data model are included in the analysis. Overlooking any report could result in missing dependencies and errors.
I genuinely hope that the Tabular Model Cleaner 2.0 becomes a valuable resource for you in your journey of creating and maintaining efficient, high-performing data models. I know firsthand how challenging and time-consuming it can be to manage complex models, especially when balancing performance, usability, and the needs of connected reports. This tool was born out of those very challenges—designed not just to save time, but to give you confidence and peace of mind as you work on your models.
🔗 Download the Tabular Model Cleaner 2.0 here


